Introduction: AI and the Environment, Seen from Europe
This book is for people who buy, build, run, govern or procure AI in a large European enterprise or public authority, and who have been told in the same week that AI is an environmental catastrophe and that it will help to solve the climate. It asks what such an organisation should do, use by use, so that the benefit is as large as possible and the environmental harm as small as possible, and what evidence it needs before it says that it has succeeded. This chapter frames the whole book and gives its thread on one page: the question, the promise and its limits, the thesis in five parts, the five environmental functions (E1 Measure, E2 Justify, E3 Design, E4 Operate and E5 Account), the net-benefit principle with its three tests (Count, Compare and Cap) and the optimisation hierarchy. It then presents the two organisations that run through every chapter, the standard of evidence and a reading path for each reader. Chapter 4 is the one place where the method is defined in full; this chapter states it briefly and every later chapter points to Chapter 4. Figure 1.1 shows the thread on one page.
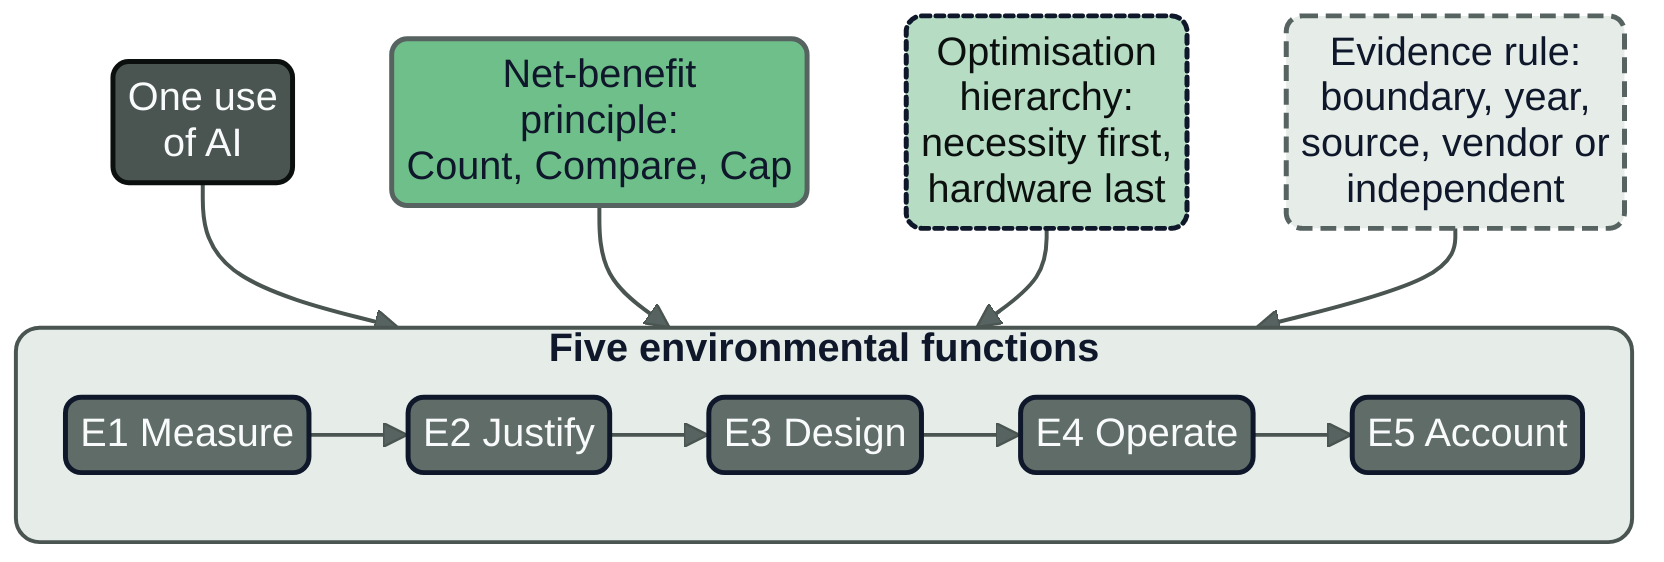
Figure 1.1: The book on one page. A single use of AI is the unit of analysis; the five functions say what an organisation does with it, and three rules (the principle, the hierarchy and the evidence rule) apply to every function. The figure carries no numbers.
Two headlines, one ledger
In the last week of September 2032 the regional director of Nordvik Region, Elisabet Holmgren, receives a draft paper for the autumn meeting of the regional council. The paper, prepared in the IT and Digitalisation Unit, is called "AI in the Region: benefit and responsibility". It contains two sentences that the council's press officer has marked as suitable for quotation. The first says that the citizen-service assistant answers each enquiry at a climate cost of 1.90 grams of carbon dioxide equivalent (CO2e), under the Region's target of 2.0 grams. The second says that AI will help the Region to reach its climate targets.
Astrid Nyberg, the Region's climate and environment strategist, is asked to review the paper before it goes to the director. She asks the head of IT, Henrik Dahl, four questions. What did the 1.90 grams count? When was it calculated? Does it cover every route by which an enquiry is answered? And what evidence stands behind the second sentence?
Henrik can answer the first three from the Region's own files, and the answers are not comfortable. The figure is a Software Carbon Intensity calculation for October 2026, six years old, for the route that uses open-weight models on reserved accelerators. It counts the energy of the GPU servers and their host, with a share of the hardware's manufacturing emissions, at the electricity factor of the Swedish grid. The route through a large hosted model, which answers the enquiries about benefit decisions, was left out because its provider published no energy figure. In October 2026 the service answered about 71,000 enquiries a month; in September 2032 it answers about 168,000. He cannot answer the fourth question at all. Nobody in the Region has measured what the assistant has changed for the climate, and the sentence says "will help", which is a forecast and not a finding.
Nobody made a number up. The first sentence is true of a system, a month and a boundary that the paper does not name. The second is a hope written as a claim. Both are the ordinary condition of public statements about AI and the environment, and the rest of this book is about how an organisation gets from that condition to a statement it can defend in the council chamber, in an audit or in a response to a request for public records.
The scene is illustrative: it is constructed from the profile of the fictional Nordvik Region (see "Two organisations" below) and describes no real organisation.
What this book promises
The book promises three things. It gives a method: five functions, an order of levers, and three tests that a use of AI passes or fails with evidence (Chapter 4). It gives a standard of evidence: every figure carries its boundary and year, and the book says whether its source is the supplier's own report or an independent one, so that a reader can see what a number is worth before using it. And it gives working records in the form an organisation can keep in version control: a footprint record, a benefit record, an environmental budget, a placement policy, a supplier disclosure record, an environmental claim record, a hardware lifecycle record and an environmental register with one row per AI use. Each is shown for one of the two example organisations, and Appendix A collects the formats.
The book does not promise a number. It does not tell the reader what "the" footprint of AI is, because no such number exists at a single boundary, and Chapter 2 shows why. It does not argue for or against AI. A reader who hopes to find ammunition for a position will find that the book gives each position its strongest evidence (Chapters 11, 19 and 25 stage the three debates in full) and then asks what can be done on either reading. It does not recommend a supplier, a model or a product; where one is named it is an example of a pattern and is cited to its own documentation or to an independent source. It does not cover the whole footprint of information technology except where that frames AI, and it does not teach environmental engineering, though that field sets its standard of method: define the system boundary, state the functional unit, compare with the alternative, report the uncertainty. It treats data centres as a buyer and an operator meets them (Chapter 18), not as a builder does. And it does not give legal advice. Statements about law are attributed to the instrument and the article, read in the text in force in November 2026, and framed as organisational and architectural implications.
It also does not fill gaps in the evidence with plausible numbers. Where nobody has measured something, the chapter says so and says what would count as evidence.
Footprint and benefit
Two terms recur on every page, and the book defines them narrowly.
The environmental footprint of an AI use is what it costs the environment: electricity, the carbon emissions that follow from it, water, materials, land and local effects, counted over the life of the models and the hardware they run on. A footprint is always a count at a boundary, which is the line that says what the count includes. Whether the count covers only the accelerators that did the arithmetic, or the whole server, or the whole building with its cooling; whether it covers only running or also the making of the hardware; whether it uses the emissions of the grid where the electricity was used or the emissions implied by the contracts the buyer holds: these are choices, and each gives a different honest number for the same work. Chapter 2 sets out seven boundaries that recur in every source in this book.
The environmental benefit of an AI use is what it achieves for the environment, and the book separates it from the ordinary benefit of a use. A citizen assistant that spares a resident a phone call has a service benefit, and it has an environmental benefit only if the avoided call, the avoided journey or the avoided energy can be shown and counted against what the assistant itself consumed. An agent that triages insurance claims faster has a business benefit; whether it has an environmental one is a separate question with its own evidence. Chapter 3 reports how much of the claimed environmental benefit of AI is shown and how much is asserted.
The unit of both is the use, not the model. A model is shared by many uses; a decision to deploy, scale, renew or stop is made for one use at a time, with an owner, a volume, a place and a supplier. The book therefore counts per resolved enquiry, per claim triaged, per request answered, per run or per session, and it treats the product of the footprint per use and the number of uses as the quantity an organisation actually manages.
Why the public positions talk past each other
The two headlines of the opening scene have counterparts in public debate, and it is useful to see what each counts before taking any side.
The first position is that AI's demand for electricity is large and growing. Its best-known source is the International Energy Agency (IEA), an independent intergovernmental body. Its April 2026 update, Key Questions on Energy and AI, estimates that all data centres in the world used 485 terawatt-hours (TWh) of electricity in 2025, measured at the facility boundary and modelled from capacity, utilisation and power usage effectiveness (the ratio of a building's total electricity to the electricity that reaches the computing equipment). In its Base Case the figure roughly doubles to about 950 TWh in 2030 (38, IEA, 2026). Chapter 2 gives the range of cases and the other IEA figures. Whether these figures describe a crisis or a manageable cost is the subject of Chapter 11; the disagreement lies in what a modelled share means for a decision, not in the figures.
The second position is that AI will deliver a large environmental benefit. In February 2026 the analyst Ketan Joshi published, for Beyond Fossil Fuels with several other advocacy organisations, a systematic reading of how prominent institutions support that claim. It coded 154 claims of climate benefit from AI; 26 per cent cited published academic papers, 36 per cent cited no evidence, and the great majority concerned traditional machine-learning applications and not the generative systems that account for most of the new demand. The report concludes that the narrative of a gigatonne-scale reduction that offsets the harm of generative AI is not supported by the results, and also that its results do not show that AI has no climate benefit (63, Joshi, 2026). Its publishers are advocacy organisations and its sample is eight prominent sources read by one author; Chapter 3 weighs it. The sources read for this book contain no measurement of the net effect of deployed AI on emissions, in either direction.
Beside these two sit the figures that circulate most widely and that are most often misread. A per-prompt figure from a provider is one of them: Google's paper reports that the median text prompt to its Gemini Apps service used 0.24 watt-hours (Wh) in May 2025, at a boundary that includes the active accelerators, the host processor and memory, idle machines and the data-centre overhead, and it is vendor-authored and not independently verified (51, Elsworth et al., 2025). A grid figure is another: on 1 November 2026 the Swedish transmission operator Svenska kraftnät listed pending requests to connect data centres to the grid of 8,200 megawatts (MW), a queue of requests for any data-centre use and not an energy forecast for AI (39, Svenska kraftnät, 2026).
Table 1.1 sets the four side by side only to show that they do not count the same thing. None of them can be divided by another, and the table gives no ratio.
Table 1.1: Four figures from public debate and what each counts (retrieved November 2026).
| Figure | What it counts | Boundary and year | Source | Kind |
|---|---|---|---|---|
| 0.24 Wh | One median text prompt | Accelerators, host, idle machines, overhead; May 2025 | Elsworth et al., 2025 | Vendor, measured |
| 485 TWh | All data centres worldwide | Facility electricity; 2025 | IEA, 2026 | Independent, modelled |
| 8,200 MW | Pending grid-connection requests for data centres in Sweden | Requests, not consumption; 1 November 2026 | Svenska kraftnät, 2026 | Independent, grid operator |
| 154 claims | Statements of AI climate benefit read for evidence | Eight sources, one coder; published February 2026 | Joshi, 2026 | Advocacy organisations |
A person who quotes the first and a person who quotes the second are answering different questions at different scales. The book offers not a fifth figure but a way of asking, for one use, which question the organisation needs answered and with what evidence.
The thesis in five parts
The book argues one thesis in five parts. It is the book's own claim, built on the earlier volumes of the series and judged in Chapters 25 and 29. Chapter 4 defines every term used below.
- The net-benefit principle. A use of AI is justified only when its benefit per unit of environmental cost is shown with evidence. Three tests apply: Count (the footprint is counted at a stated boundary and year), Compare (the benefit is measured against the non-AI alternative and against the rebound the use causes) and Cap (the use runs under an environmental budget with a stop path outside the system it stops). Neither side pays for the other: an unproven benefit does not offset a measured footprint, and a purchased offset does not replace reduction.
- The use is the unit. Models are shared and decisions are made per use. Efficiency per unit that is outrun by volume is not progress, so rebound, the extra demand that cheaper or better service induces, is measured and not assumed away.
- The optimisation hierarchy. The levers for reducing a footprint have an order of size and of cost: necessity, sufficiency of model, efficient serving, place and time, hardware and lifecycle. Each is tested for the evidence that it saves what is claimed, and a lower lever is not a reason to skip a higher one.
- Agents carry a budget. An agent that can start work can spend resources. Its mandate includes a resource budget set by someone other than the agent, measured outside the agent, with a stop path outside the system it stops. This is the observer and independence principles of the series applied to resources.
- Claims need evidence, and evidence expires. Provider figures, supplier disclosures, footprint estimates and benefit claims are claims. Each has a boundary, a date and an independent check, or it is labelled as vendor-reported or as an estimate.
The thread on one page
The book divides the work into five environmental functions. They are named exactly, and they are not the operations functions O1 to O5 of AI Operations, the leadership functions L1 to L5 of AI Leader or the developer functions D1 to D5 of AI Developer. Parts II to VI each concern one function; Part I (Chapters 1 to 4) frames them and Part VII (Chapters 26 to 29) concludes. Table 1.2 gives the question each function asks and where the book treats it.
Table 1.2: The five environmental functions.
| Function | What it asks | Chapters |
|---|---|---|
| E1 Measure | What does this use cost the environment, at which boundary, in which year, by which method? | 5 to 8 |
| E2 Justify | Is the use worth its footprint, compared with the alternative and with the rebound it causes? | 9 to 11 |
| E3 Design | How is the solution shaped for less: model, serving, training or retrieval, agents' budgets, hardware? | 12 to 16 |
| E4 Operate | Where, when and under which budget does the use run, and who can stop it? | 17 to 20 |
| E5 Account | What is owed in law, in reporting and in contracts, and what may the organisation claim? | 21 to 25 |
The functions are a loop and not a sequence: a measurement (E1) informs a justification (E2), which shapes a design (E3), which is operated under a budget (E4) and accounted for in a report or claim (E5) whose evidence must in turn be measured. An organisation that starts at E5, with a report to file, usually finds that it has nothing at E1 to put in it.
Two further parts of the method apply to every function. The optimisation hierarchy orders the levers for a smaller footprint by size and cost: necessity (do not run what is not needed), sufficiency of model (the smallest model that meets the requirement), efficient serving (quantisation, caching, batching, routing, retrieval in place of training), place and time (where and when the grid is cleaner and water is not scarce) and hardware and lifecycle (utilisation, embodied impact, reuse). A lower level is no reason to skip a higher one, each level is tested for the saving it delivers, and a change at any level re-opens the three tests.
The net-benefit principle is the test that a proposed, scaled or renewed use must pass. Count requires the footprint at a stated boundary and year. Compare requires the benefit against the non-AI alternative and against rebound. Cap requires an environmental budget, set by someone who is not the agent, measured outside the system it limits, with a stop path outside the system it stops. A use can pass one test and fail another, and the book says which each piece of evidence passes. A common result in the worked examples is that Count passes with a stated uncertainty, Compare fails for lack of a comparison, and Cap has never been tested by stopping the use. That is the typical position of an organisation that has begun, not a criticism of it. Chapter 4 gives the definitions, the budget, the delegation ceiling and the records.
The standard of evidence
The book holds itself to the following rules. They apply to its own sentences as much as to the sources it reads, and they are the reason that chapters are longer than a summary of the headline figures would need to be.
Boundary and year on every figure. A figure about energy, carbon, water, materials, land, cost or benefit states, in the sentence or the table, its boundary (operational or lifecycle; accelerators only, whole server or whole facility; location-based or market-based; on-site or total water; median or mean; per prompt, per task or per run), the year of the data, its source, and the month in which the book retrieved the source. Figures with different boundaries are never compared, summed or placed on one axis without saying so.
Vendor-reported or independent. A figure that a supplier reports about its own service is labelled vendor-reported, even when it is carefully measured, because the supplier chose the boundary and nobody outside has checked it. An independent source is one that has no stake in the number. The label does not make a figure wrong; it tells the reader what to ask of it.
Measured, modelled, projected or asserted. The book distinguishes a count from a meter, a calculation under stated assumptions, a projection of the future and a statement with no method. Chapter 2 gives the four terms their definitions and applies them to every major source.
Neither side pays for the other. An unproven benefit is not set against a measured footprint, and a purchased offset is not set against a reduction that was not made. This is not a rule against offsets or against believing in benefits. It is a rule about what a sentence may say: a footprint stands on its count, a benefit on its comparison, and the two are put side by side with the evidence for each, never netted into one claim.
Illustrative figures are labelled. The environmental figures of the two example organisations are invented and every one is labelled illustrative. They are never mixed with real figures in one table without a column that says which is which.
Observable, expected, speculation. Every statement about the future of AI demand, energy, regulation or the technology carries one of the three labels of AI Governance, Chapter 22 (26, Nordqvist, 2026). A statement is observable when it describes something happening now and documented, expected when a stated trend or a decided instrument supports it, and speculation when it is plausible and unevidenced. The author's own projections are confined to Chapters 25 and 29 and are labelled there as such.
Evidence expires. Wherever a chapter tells the reader to record that something was measured, checked or claimed, the record carries the date and the result and the chapter says how long the evidence is valid. The starting values the book uses are illustrative and are set by Chapter 4 and fixed by Chapter 24: 90 days for the measured footprint of a running use, 180 days for a benefit record, 12 months for a supplier disclosure and the reporting year for a claim. Nordvik Region's 1.90 grams in the opening scene was good evidence in 2026 and had long expired by 2032.
The book applies the standard to itself. The energy of the agents that drafted, checked and revised this manuscript was counted from their recorded token usage on 16 November 2026, with the boundary, the exclusions and the proxies stated. It is the one worked record in the book that is real and not illustrative (Chapter 8, FPR-BK-0001). It passes the Count test only in part and fails the Cap test, and Chapter 29 draws the lesson.
Practical guide: a one-page inventory of AI uses
Purpose. Before any measurement, list the AI uses of the organisation on one page, with an owner, a supplier, a place and a note of whether anything is measured. The inventory is the seed of the environmental register of Chapter 4 and shows quickly where the evidence is thinnest.
Roles. The sustainability lead convenes it. The head of IT or cloud, the platform or FinOps practitioner, the AI product owners and the procurement officer each supply the rows they know.
Inputs. The AI gateway or billing reports (which uses exist and at what volume), the contract list (which supplier, which region), the licence list for assistants in office software, and the sustainability report of the last year.
Steps.
- List every use as a row. A use is a service with an owner and a volume, not a model; two services on one model are two rows.
- For each row, record the usage mode (Mode 0 Ambient AI to Mode 5 Autonomous production agents; see below), the supplier, the region and the unit of work (a resolved enquiry, a claim triaged, a request answered, a run).
- Record the monthly volume in that unit and the date of the figure.
- Record whether anything about the footprint is measured, by whom, on which date and at which boundary. Write
nonewhere nothing is. - Record whether any benefit has been measured against an alternative. Write
nonewhere it has not. - Mark the rows that the organisation cannot meter itself (usually Modes 0 to 2) as supplier-reported.
- Give the page to the person who signs the organisation's environmental statements.
Artefact. The inventory, in version control. The extract below shows two illustrative rows for Nordvik Region in the form used in the book. The footprint record FPR-NR-0001 and the benefit record BEN-NR-0001 are written in Chapters 6 and 9.
# inventory/ai-uses.yaml (illustrative; extract; Nordvik Region, September 2032)
as_of: 2032-09-30
owner: henrik-dahl
uses:
  - id: FPR-NR-0001
    name: Citizen-service assistant, open-weight route
    mode: 4            # Built AI applications
    supplier: hosting provider, reserved accelerators (contract NR-2026-031)
    region: eu-north-1
    unit: resolved enquiry
    volume_per_month: 146000
    footprint_measured:
      date: 2026-10-31   # the Region's last documented calculation
      boundary: GPU servers and host, with allocated hardware emissions
      age_days: 2161     # to 2032-09-30; expired
    benefit_measured: none
  - id: FPR-NR-0002
    name: Citizen-service assistant, eligibility-explanation route
    mode: 4
    supplier: hosted large-provider model through the AI gateway
    region: EU, site not disclosed
    unit: explanation delivered
    volume_per_month: 22000
    footprint_measured: none
    benefit_measured: none
Evidence age: the inventory itself is valid for 90 days, the interval after which an unchanged row is treated as unchecked.
Two organisations
Two fictional organisations run through every chapter. They are shared with the other AI volumes of the series, and their environmental profile is added for this book. Neither is real, and the figures of the environmental profile are illustrative. The organisations' year runs from September 2032 to August 2033, a period after the builds of Vibe to Dev. The law and the evidence the book reads are those in force in November 2026, as in the earlier volumes. When a scene in 2032 quotes a figure from 2026, the age of that figure is part of the scene.
Nordvik Region is a regional public authority in Sweden, with about 6,000 employees and about 450,000 residents. It buys most of its AI as services: reserved accelerators at a European hosting provider in a Nordic data centre (contract NR-2026-031), a large hosted model reached through its AI gateway, and a provider-run application in its own regional data centre, nordvik-dc, of about 640 kilowatts. It is accountable to elected politicians and to the public, subject to public procurement law and to Swedish rules of public access to official records, so that its records of AI uses, including footprint and benefit records, can be requested by anyone unless classified. The book therefore writes every Nordvik claim so that it can be read in public. It is not a reporting entity under the Corporate Sustainability Reporting Directive (CSRD, Directive (EU) 2022/2464), which Chapter 21 confirms. Its lever is the contract and the tender: it can put environmental evidence into the next hosting tender, whose annex is TA-NR-ENV-01. Its measurement is thin, and its citizen assistant has grown about 2.4 times since the last calculation.
Hansa Mutual is a mutual insurance group headquartered in Hamburg, with about 9,500 employees and subsidiaries in seven jurisdictions. It runs its own accelerators in a data centre in Frankfurt (hansa-dc-frankfurt, about 2.8 megawatts), takes burst capacity from two cloud suppliers, Cloud A and Cloud B, and uses hosted model providers for non-sensitive routes. It is a large undertaking that reports under the CSRD in the form in force in 2026, with Scope 1, Scope 2 and Scope 3 emissions by entity and limited assurance. Scope 2 is the emissions of purchased electricity, reported in two ways, location-based and market-based (Chapter 2 defines both); Scope 3 is the emissions of the value chain, which for cloud and software services the group estimates from spend and supplier figures. Its lever is its own platform: it can meter its racks, route models by task and give its agents a budget. AI is not separable inside its Scope 2 and Scope 3 figures, it runs two Mode 5 agents that make many model calls per task, and its board has stated that AI work "became more efficient" with no record behind the statement.
Table 1.3 sets out what differs, because the differences are what makes the pair useful. A method that works for both has met two rather different organisations.
Table 1.3: What differs between the two organisations (profile; all organisational figures illustrative).
| Nordvik Region | Hansa Mutual | |
|---|---|---|
| How it gets AI compute | Buys it: reserved accelerators, a hosted model, a provider-run application | Mixes its own Frankfurt capacity with cloud burst and hosted providers |
| Reporting regime | Public authority; annual report; public-access rules; no CSRD duty | Group sustainability statement under the CSRD |
| Grid, location-based (profile value) | Swedish, 32 g CO2e per kWh | German and EU regions, 350 g CO2e per kWh for Frankfurt |
| What it can do | Write evidence into contracts and tenders | Meter its own platform and route models by task |
| Agents | No Mode 5; a small platform team with Mode 3 tools | Two Mode 5 agents |
How fresh the evidence is
The book reads the evidence of November 2026, retrieved between 10 and 16 November, and the field moved a great deal in that year: new regulation, new provider disclosures, a bottom-up model estimate of energy per query (by Microsoft authors), and a change in how the IEA itself frames future demand. A book on this subject goes out of date in months, so Table 1.4 lists what was moving when it was written, and every source carries its retrieval month.
Table 1.4: Evidence that was still moving on 16 November 2026, and what would change it.
| Item | State on 16 November 2026 | Source and kind | Refresh when |
|---|---|---|---|
| Data-centre rating scheme | Delegated act C(2026) 3472 final adopted 21 September 2026; not in the Official Journal; first labels due 15 August 2027 under Article 3 if in force | European Commission, 2026; legal text | Published, objected to or amended |
| Minimum performance standards | Consultation closes 14 December 2026; Commission proposal planned for the second quarter of 2027 | European Commission, 2026; official news item | The proposal appears |
| Green claims | Green Claims proposal on the Commission's list for withdrawal; Directive (EU) 2024/825 applies from 27 September 2026 | European Commission, 2026; European Parliament and Council, 2024 | Formal withdrawal or national enforcement |
| AI Act documentation | Model Documentation Form asks for training energy and inference compute, not inference energy | European Commission, 2025; official form | Revised form or standard |
| Standards | prEN 18287:2026 (environmental impact evaluation of AI) in public enquiry to 23 December 2026; Software Carbon Intensity specification for AI is a Green Software Foundation text, its status described differently in different places | CEN/CENELEC, 2026; Green Software Foundation, 2026 | Publication of the standard |
| Demand projections | IEA, April 2026: 485 TWh in 2025 and about 950 TWh in 2030 in the Base Case; all data centres worldwide, facility boundary; modelled | IEA, 2026; independent | A new IEA update |
| Provider per-prompt figures | 0.24 Wh, median text prompt, May 2025 data; vendor-reported | Elsworth et al., 2025; vendor | A newer disclosure with its boundary |
| Swedish grid queue | 8,200 MW of data-centre connection requests on 1 November 2026; requests, not consumption | Svenska kraftnät, 2026; grid operator | The next monthly statistics |
The sources for Table 1.4 are (15, European Commission, 2026), (93, European Commission, 2026), (94, European Union, 2024), (16, European Commission, 2026), (74, European Commission, 2025), (77, CEN/CENELEC, 2026), (75, Green Software Foundation, 2026), (38, IEA, 2026), (51, Elsworth et al., 2025) and (39, Svenska kraftnät, 2026).
Two cautions follow. The legal items are described as their status allows: the Commission has adopted the rating act and it is not yet in force, and the withdrawal of the Green Claims proposal is announced and not formally carried out. A reader who needs the position on a particular date should read the instrument, not this table. And some figures the public debate relies on could not be verified for this book, so it does not state them as fact; Chapter 2 sets out what is not known.
How to read this book
The book can be read in order, and Part I is meant to be read first by everyone. After it the chapters divide by the question a reader brings. Table 1.5 gives each kind of reader the chapters to read first and next, and the record to be able to produce afterwards. All readers should read Chapter 4, which defines the method that the others apply, and Chapter 2, which teaches the habit of reading a figure by its boundary.
Table 1.5: Reading paths by role.
| Reader | Read first | Then | Leave with |
|---|---|---|---|
| Sustainability lead | 2, 4, 6 to 8 | 21, 22, 24 | A footprint record per use and a claim record |
| Head of IT and cloud | 4, 12, 13 | 15, 17 to 20, 24 | An environmental budget and a placement policy |
| Platform and FinOps practitioner | 6, 8, 12, 13 | 15, 17, 20 | A measurement plan and a budget with a stop path |
| AI product owner or architect | 3, 4, 9 | 10, 12, 13, 15, 24 | A benefit record and a model-choice record |
| Procurement officer in a public authority | 5, 8, 19 | 21, 23, 24 | A tender annex and a supplier disclosure record |
| Board member | 2, 4, 11 | 22, 24, 25, 28 | The questions to put to management, and a watch list |
| Auditor | 4, 8, 22 | 21, 24, 31 | A test of the register and of a claim |
The platform and FinOps or GreenOps practitioner (the person who manages cost and, increasingly, carbon of cloud and platform use) will find that Chapters 6, 8 and 20 extend the showback already run; AI Operations, Chapter 11 and AI Platform and Security, Chapter 22 are the earlier treatments of capacity and cost, and this book does not repeat them (34, Nordqvist, 2026) (27, Nordqvist, 2026). The data-centre or energy manager and the legal counsel will find their material in Chapters 7, 17, 18 and 21.
The back matter holds a glossary (Chapter 30), Appendix A with the record formats (Chapter 31), Appendix B on templates and tools, the references (Chapter 32) and a note on the author (Chapter 33). The formats are meant to be copied, and every worked example in the book is an instance of one.
Across the modes and the organisations
Across the usage modes
The series defines six usage modes by how deeply AI is integrated and how much autonomy it has (AI Governance, Chapter 2) (26, Nordqvist, 2026). The environmental questions differ across them, and so does what an organisation can see. Table 1.6 gives the first question for each mode; Chapters 2, 4 and 15 develop them.
Table 1.6: The first environmental question for each usage mode.
| Mode | What the organisation can usually see | The first question |
|---|---|---|
| Mode 0 Ambient AI | Nothing at use level; a supplier statement at best | Is the AI there, and what does the contract let us ask? |
| Mode 1 Conversational assistants | Seats, and sometimes message counts | Who receives a seat, and for what work? |
| Mode 2 Embedded workplace assistants | Licences and usage reports | What does a seat add, and is it used? |
| Mode 3 Agentic work tools | Tasks and tokens through the gateway | What budget does a session run under? |
| Mode 4 Built AI applications | Requests, tokens, utilisation, cost | What is the footprint per request, and per route? |
| Mode 5 Autonomous production agents | Runs, calls and spend | What is the energy per completed task, and who can stop the run? |
In Modes 0 to 2 the lever is commercial, a renewal or a seat, and the footprint is mostly the supplier's. In Modes 3 to 5 the footprint follows consumption, so the lever is a budget in the mandate. Volume tends to sit in Modes 4 and 5 and visibility is lowest in Modes 0 to 2, which is why those rows enter the register as supplier-reported.
Across the degrees of delegation
The degrees of delegation are the series' autonomy levels, from Level 0 Advisory to Level 4 Autonomous. This book adds four prohibitions on the top level, and they recur in the chapters on E3 Design, E4 Operate and E5 Account. Level 4 is never used for an agent that provisions or scales its own compute, or starts work, beyond a budget set by someone else; for an action that disables the measurement, the budget or the stop path itself; for the publication of an environmental claim; or for a decision about a named person's access to work. An agent may measure, recommend and, within a mandate, schedule or stop; it may not widen its own allowance, blind the system that watches it, or speak for the organisation in public. Chapter 4 gives the starting ceilings per action class and Chapter 15 applies them to agents.
Nordvik Region and Hansa Mutual
Each organisation enters the book year with a question that the method will turn into records. The statements below are illustrative and are written as the people concerned might put them at the start of September 2032.
At Nordvik Region, Ida Pettersson, procurement manager, whose team holds the contract with the hosting provider and will run its re-tender, would put it this way: "We can write a clause into the next tender, but only about things we know to ask. We do not know the energy of the hosted model route, our provider gives us the building's efficiency and not our share of it, and the assistant now answers more than twice as many enquiries as the last time anyone counted. I need to know what to ask for and how heavily to weight it." Behind her question sit Chapters 5, 8, 19 and 23.
At Hansa Mutual, Dr. Verena Lindner, head of group sustainability and CSRD reporting, who owns the method for counting AI inside Scope 2 and Scope 3, would put it this way: "I can tell you the group's electricity and I can tell you what the Frankfurt racks drew last month. I cannot tell you how much of the group's footprint is AI, I cannot give you energy for a completed claim by the triage agent, and the board has said that AI work became more efficient. I will not sign that sentence until there is a record behind it." Behind her question sit Chapters 6, 8, 22 and 24.
Table 1.7 lists the opening question of each organisation by function, so that a reader can follow either through the book. The questions are answered in the chapters named in Table 1.2.
Table 1.7: Opening questions by function (illustrative).
| Function | Nordvik Region | Hansa Mutual |
|---|---|---|
| E1 Measure | How does the Region replace a six-year-old figure and count a route that discloses nothing? | How does the group count the energy of an agent run and AI inside Scope 2 and 3? |
| E2 Justify | What benefit record stands behind the staff assistant? | What is the benefit of the triage agent per claim, against what alternative? |
| E3 Design | Which route needs the large hosted model? | How does the group route models by task and give agents a budget? |
| E4 Operate | Where and when do the reserved accelerators and retraining run? | Where does burst capacity run, and what does Frankfurt do with its heat? |
| E5 Account | How does the Region write evidence into its tender and correct its public statement? | How does the board make its efficiency statement defensible? |
Parts II to VI answer these questions in order. Chapter 27 follows both organisations through the year and Chapter 28 draws a conclusion for each. Chapter 4 defines the record families (FPR, BEN, EBG and the others), and Chapter 24 keeps the register that lists them.
Observable, expected, speculation
The book's own statements about the future follow the labels of the standard of evidence. The following are the ones this chapter makes.
Observable. Data-centre electricity consumption is growing: the IEA's April 2026 estimate is 485 TWh in 2025, 17 per cent above 2024, at the facility boundary for all data centres worldwide (38, IEA, 2026). Providers are disclosing more about the energy of AI per use than they did, with the boundary and vendor caveats given above (51, Elsworth et al., 2025).
Expected. More regulation of disclosure in Europe is expected, because the instruments exist: the rating act of 21 September 2026 would produce the first data-centre labels from 15 August 2027 if it enters into force, and the Commission plans a proposal on minimum performance standards for the second quarter of 2027 (15, European Commission, 2026) (16, European Commission, 2026). The IEA's Base Case of about 950 TWh in 2030 is a projection, not a measurement (38, IEA, 2026).
Speculation. Any statement about the net effect of AI on the climate, whether that it will be large and positive or that it will be large and negative, is speculation at the time of writing, because the sources read for this book contain no measurement of it for deployed AI. The thesis of this book, that a use of AI is justified when its benefit per unit of environmental cost is shown with evidence, is the book's own claim. Chapters 25 and 29 judge it and carry the author's projections, labelled as such.
Summary
This chapter framed the book. The question is what a European enterprise or public authority should do, use by use, to get the largest benefit for the smallest environmental harm, and what evidence it needs to say that it has. The book promises a method, a standard of evidence and working records. It does not promise a number, argue for or against AI, recommend a supplier or give legal advice, and it does not fill gaps in the evidence with plausible figures. The public positions talk past each other because they count different things at different scales, as the four headline figures of Table 1.1 show, and the book answers by fixing the boundary before it counts.
The thesis has five parts: the net-benefit principle with its tests Count, Compare and Cap; the use as the unit; the optimisation hierarchy; the budget for agents; and the rule that claims need evidence and that evidence expires. The five functions, E1 Measure, E2 Justify, E3 Design, E4 Operate and E5 Account, organise Parts II to VI. Every figure in the book carries its boundary and year, no unproven benefit is offset against a measured footprint, statements about the future are labelled observable, expected or speculation, and the evidence is that of November 2026, with a list of what was still moving. Nordvik Region and Hansa Mutual carry the worked examples, and their figures are illustrative.
The reader can act on this chapter at once. Make the one-page inventory of AI uses for your organisation, mark every cell that says none, and bring it to Chapter 4, where the method is defined. Chapter 2 follows, with what the evidence says in November 2026 about the energy, carbon, water and materials of AI and why honest figures disagree.
Sources
- Nordqvist, G. (2026). AI Governance: Governing Artificial Intelligence in European Enterprises and Public Authorities. The Transformed Architecture, Book 2, published at aig.geon.se. (26, Nordqvist, 2026)
- Nordqvist, G. (2026). AI Platform and Security: Building and Securing AI Platforms in European Enterprises and Public Authorities. The Transformed Architecture, Book 3. (27, Nordqvist, 2026)
- Nordqvist, G. (2026). AI Operations: How Artificial Intelligence Transforms IT Operations in European Enterprises and Public Authorities. The Transformed Architecture, Book 10, published at aiops.geon.se. (34, Nordqvist, 2026)
- International Energy Agency (2026). Key Questions on Energy and AI. World Energy Outlook Special Report, April 2026. Independent; modelled and projected figures; retrieved November 2026. (38, IEA, 2026)
- European Commission (2026). Minimum performance standards for data centres in Europe: public consultation launched. News item, 21 September 2026; retrieved November 2026. (16, European Commission, 2026)
- Elsworth, C., Huang, K., Patterson, D. et al. (2025). Measuring the environmental impact of delivering AI at Google Scale. arXiv:2508.15734, 21 August 2025. Vendor-authored; retrieved November 2026. (51, Elsworth et al., 2025)
- Svenska kraftnät (2026). Information om pågående anslutningsärenden, statistics as at 1 November 2026; retrieved November 2026. (39, Svenska kraftnät, 2026)
- Joshi, K. (2026). The AI Climate Hoax. Beyond Fossil Fuels with Friends of the Earth US, Stand.earth, Green Screen Coalition, Green Web Foundation and Climate Action Against Disinformation, February 2026. Publication of advocacy organisations; retrieved November 2026. (63, Joshi, 2026)
- European Commission (2025). Model Documentation Form, Transparency chapter of the General-Purpose AI Code of Practice. European AI Office; retrieved November 2026. (74, European Commission, 2025)
- Green Software Foundation (2026). Software Carbon Intensity for AI Specification. Repository Green-Software-Foundation/sci-ai; retrieved November 2026. (75, Green Software Foundation, 2026)
- CEN/CENELEC (2026). oSIST prEN 18287:2026, Artificial Intelligence: Requirements and guidance for the environmental impact evaluation of artificial intelligence systems and services. Draft in public enquiry (28 October to 23 December 2026); retrieved November 2026. (77, CEN/CENELEC, 2026)
- European Commission (2026). Commission Delegated Regulation supplementing Directive (EU) 2023/1791 as regards the establishment of a common Union rating scheme for data centres and amending Delegated Regulation (EU) 2024/1364. C(2026) 3472 final, 21 September 2026; adopted by the Commission, not yet published in the Official Journal; retrieved November 2026. (15, European Commission, 2026)
- European Commission (2026). Commission work programme 2027. COM(2026) 710 final, 4 November 2026, Annex III; retrieved November 2026. (93, European Commission, 2026)
- European Parliament and Council of the European Union (2024). Directive (EU) 2024/825 amending Directives 2005/29/EC and 2011/83/EU as regards empowering consumers for the green transition through better protection against unfair practices and through better information. Official Journal of the European Union, 6 March 2024; retrieved November 2026. (94, European Union, 2024)