What the Evidence Says Now: Energy, Carbon, Water and Materials
Chapter 1 asked what an organisation should do, use by use, and what evidence it needs. This chapter reports what is known in November 2026 about the electricity, carbon, water and materials that AI uses, with sizes, shares and the uncertainty that belongs to each. It concerns E1 Measure, the first of the five environmental functions that Chapter 4 defines: counting a footprint at a stated boundary, in a stated year, by a stated method. The method for counting is Chapter 4. This chapter gives what is needed before any counting starts: the size of the question, the reasons why honest figures disagree, and a habit of reading every number by its boundary.
The figures of public debate fall into two camps that rarely meet: a single query as a few drops of water and a fraction of a watt-hour, and a national grid or a queue of requests in gigawatts. Both can be correct, because they count different things. Figure 2.1 shows the steps by which one count grows into the other.
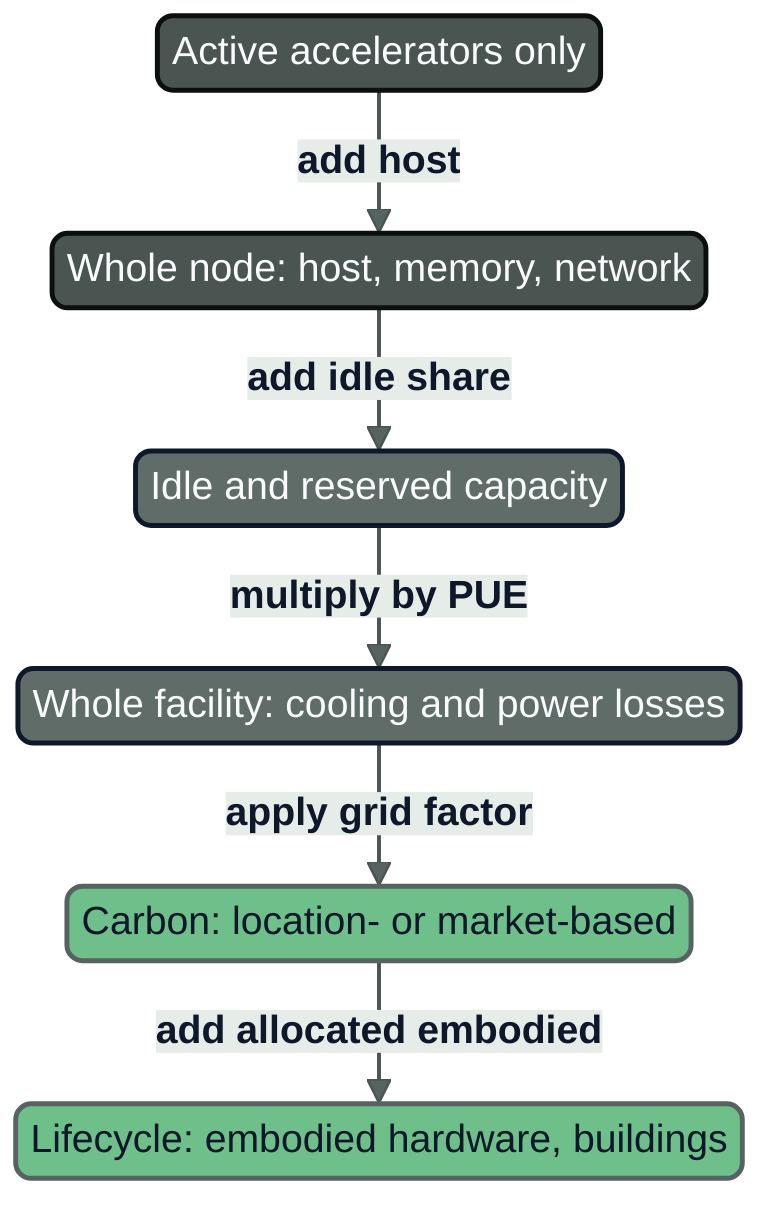
Figure 2.1: Why two figures differ. Each step outward adds energy or emissions to the count and gives a larger honest number for the same work; the figure is a schematic, not a measurement.
The chapter builds on two earlier conclusions. AI Platform and Security, Chapter 22, showed that energy per unit of work depends on model size, utilisation and location (27, Nordqvist, 2026). AI Threat, Chapter 17, reported the International Energy Agency (IEA) figures of April 2025 (about 415 terawatt-hours, TWh, for data centres in 2024, projected to about 945 TWh in 2030) and noted that the Energy Efficiency Directive reports buildings and not workloads, so that nobody is obliged to state the energy of an inference request (29, Nordqvist, 2026). This chapter updates their figures with the evidence of 2026, which changed in three ways: the first measured European data, a bottom-up model estimate of energy per query by Microsoft authors, and a change in how the IEA frames future demand.
Why boundaries come first
A boundary is the line that says what a figure includes. Two figures with different boundaries are not in conflict, because they answer different questions, and comparing them as if they did is the commonest error in this field. Seven boundaries recur in every source used in this book, and Table 2.1 names them. The reader should be able to recite them, because Chapter 4 turns them into the first test of the net-benefit principle, Count.
Table 2.1: The seven boundaries to hold while reading any footprint figure.
| Boundary | The two ends of the choice | What changes between them |
|---|---|---|
| Phase | Operational (electricity in running) against lifecycle (adds manufacture, transport, construction, disposal) | Lifecycle figures are larger and include hardware made years earlier |
| Equipment | Active accelerators only; whole node (host, memory, networking); whole facility (adds cooling, power conversion) | Each step outward adds energy; facility to IT energy is the power usage effectiveness (PUE) |
| Idle capacity | Energy while serving, or also of machines held ready | A pool at 50 per cent utilisation spends much of its energy waiting |
| Electricity accounting | Location-based (average grid emissions where used) against market-based (emissions implied by the buyer's contracts and certificates) | The same kilowatt-hour can have very different emission factors |
| Water | Withdrawal (taken) against consumption (not returned); on-site (cooling) against total (adds generation) | Withdrawal is usually much larger than consumption |
| Statistic and unit | Median against mean; per prompt, task, enquiry or agent run; a stated period | Long reasoning outputs and multi-step tasks move a mean far more than a median |
| Provenance | Measured, modelled, projected or asserted; vendor-reported or independent | A modelled or projected figure is a calculation, not an observation |
Every figure in this book states the boundary, the year, the source and whether the source is vendor-reported or independent, in the sentence or in the table. This chapter applies the rule to itself: where a boundary could not be established from the source, the text says so.
Energy: sizes and shares
Data centres in the world
Data centres are the buildings that house the servers on which AI runs; AI is one of several uses of them, and no public statistic separates the electricity of AI from the electricity of everything else in the same building. The best available aggregate figures come from the IEA, which in April 2026 published Key Questions on Energy and AI as an update to its 2025 report (38, IEA, 2026). The boundary of its figures is total facility electricity for all data centres in the world, modelled from capacity, utilisation and PUE, and the IEA is independent of the industry it describes.
On that boundary, data-centre electricity consumption was 485 TWh in 2025 (Table A.4 of the report), after about 416 TWh in 2024. It grew by 17 per cent in 2025, which the IEA says was in line with its projections. Electricity use of AI-focused data centres, the subset with large numbers of accelerated servers, grew faster still, by 50 per cent in 2025. In the Base Case, consumption roughly doubles to about 950 TWh in 2030, around 3 per cent of global electricity demand, and the AI-focused subset triples to about 465 TWh. The IEA adds a proportion that matters for a sense of scale: data centres account for slightly less than 10 per cent of the growth in global electricity demand to 2030 (38, IEA, 2026). The remaining 90 per cent comes from industry, transport, cooling and heating, which the same grids must also supply.
Two outputs of the IEA analysis show why a single global number conceals more than it reveals. The first is the spread of cases. The IEA models four cases for 2030, and the totals in its table run from 833 TWh in the Headwinds Case through 868 TWh in the High Efficiency Case and 945 TWh in the Base Case to 1,008 TWh in the Lift-Off Case. The 2035 values, which the IEA marks as exploratory scenarios given the high level of uncertainty, run from 942 to 1,637 TWh; the narrative of the report quotes the wider range of 700 to 1,700 TWh for 2035, which Chapter 11 reads. A reader who quotes "about 950 TWh" without the range quotes a central case as if it were a measurement. The second is the spread of efficiency. The same table gives a PUE of 1.13 for hyperscale data centres in 2025, 1.49 for colocation and service-provider sites and 1.89 for enterprise sites, so a kilowatt-hour of computing in an enterprise server room needs far more facility electricity than in a hyperscale hall.
The emissions that follow are modest on the IEA's boundary. It reports that emissions associated with data centres double in its projections, to about 350 million tonnes of carbon dioxide in 2035, still about 2 per cent of global electricity-sector emissions at that date (38, IEA, 2026). That is a Base Case projection stated in the report's discussion of social concerns, so it is a headline and not a modelled series.
The 2026 shift in how demand is framed
The IEA's central projection to 2030 did not change much between April 2025 and April 2026; the report says that it "remains close to the trajectory set out in the IEA's 2025 report". What changed is the reason the IEA gives for the uncertainty around that trajectory. In 2025 the question was mainly whether demand would be large. In 2026 the IEA writes that investments in data centres have grown too large to be funded from company balance sheets alone, that large amounts of capital-market funding will be critical, and that, as a result, "the pace of data centre growth, and the resulting increase in energy consumption, will be sensitive to market sentiment, including expectations for returns on investment in data centres and AI deployment, as well as to broader macroeconomic and financing conditions" (38, IEA, 2026).
The report gives the evidence for that framing: a shift in investor sentiment in the second half of 2025 towards a more cautious stance, a 75 per cent increase in announced capital expenditure for 2026 by leading hyperscalers and neo-clouds, to USD 715 billion, and growth estimates that imply cumulative investment of USD 3.9 trillion between 2026 and 2030. It also names physical bottlenecks (grid connections, stretched planning systems, and a shortage of high-bandwidth memory expected to persist through at least the end of 2027) that, the IEA concludes, reduce the likelihood of more aggressive near-term scenarios.
Demand in 2025 is therefore the IEA's modelled estimate and the best aggregate available; demand in 2030 is a scenario whose range depends as much on capital markets as on the technology. An organisation should record the basis of any planning figure and the date at which it was true. The label for the statement about 2030 is expected for the Base Case direction, which rests on a stated trend and on decided investment, and speculation for the point value, which depends on conditions that the IEA itself calls uncertain.
Europe and the member states
The Commission's report on the energy efficiency of data centres in the Union (COM(2026) 500, 21 September 2026) gives the European figures (11, European Commission, 2026). Data centres in the Union consumed 68 TWh of electricity in 2024, which is expected to rise to 114 TWh by 2030, 3.2 per cent of the Union's electricity demand (an expected value, a projection by outside bodies). The footnotes point to the IEA for both TWh figures and to Eurelectric for the share of demand, so they are an estimate by outside bodies adopted by the Commission, not a measurement by it. The report itself says that the projections could be revised upwards.
The same report contains the first measured data under Article 12 of the Energy Efficiency Directive, which requires operators of data centres with an installed IT power of at least 500 kilowatts to report to a European database (5, European Union, 2023). In the first reporting period 770 data centres reported, representing around 36 per cent of the estimated total in scope; six Member States reported none and five reported fewer than three. The average reported PUE in 2024 was 1.36 and the average water usage effectiveness (WUE), defined by the Commission as the ratio of total water input to IT equipment energy, was 0.58 litres per kilowatt-hour of IT energy (11, European Commission, 2026). Both are energy-weighted averages of the sites that reported reliable data, which is why the PUE of the IEA's table (1.38 worldwide in 2025, with a different weighting and population) and the Commission's 1.36 must not be read as one series.
The national figures show a concentration that the European average hides. In Ireland, the Central Statistics Office (CSO) found that data centres used 7,663 gigawatt-hours (GWh) of metered electricity in 2025, 23 per cent of the national total of 32,986 GWh, against 22 per cent in 2024 and 5 per cent in 2015. The CSO adds a caveat that belongs to the claim: data centres are not separately classified in the source data, and the office identified them from operator names, industry reports and a review of high-consumption customers (40, Central Statistics Office (Ireland), 2026). In Sweden, the worked national case of this book, the transmission system operator Svenska kraftnät listed 8,200 megawatts (MW) of applied-for consumption by data centres in its connection queue on 1 November 2026, rounded to the nearest 50 MW. The figure counts capacity applied for until capacity has been reserved and a preliminary notice sent. It is neither secured capacity, nor planned consumption, nor measured electricity use, and it cannot be converted into TWh without assumptions about build-out and load factor that no source in this chapter supplies (39, Svenska kraftnät, 2026).
Why estimates differ
A second global estimate shows how much the definition matters. Chen and colleagues, in Communications Sustainability in September 2026, projected that electricity use by data centres built for AI could rise from about 118 TWh in 2024 to between 239 and 295 TWh by 2030, about 1 per cent of global electricity demand. The study combines a large-language-model analysis of corporate, policy and media sources with scenario-based projections (53, Chen et al., 2026). That is a projection for AI-built data centres, which is a subset of the IEA's total of about 950 TWh and is defined differently from the IEA's AI-focused data centres (about 465 TWh in 2030 on the IEA's boundary). The three figures are not in conflict. They answer three questions: how much electricity all data centres will use, how much the accelerator-heavy ones will use on the IEA's modelling, and how much AI-built capacity will use on a text-analysis method.
Three reasons explain most of the spread between estimates of data-centre demand: the population (all data centres, AI-focused ones, or the sites of named operators), the unit (IT load, which excludes cooling and conversion, or total facility electricity) and the basis (secured capacity, capacity under construction, or the pipeline of announced projects, which the Svenska kraftnät queue illustrates).
Carbon
Carbon follows from energy through the emission factor of the electricity, and the factor depends on where and when the electricity is used and on how the user accounts for it.
From energy to emissions: grid factors
Grids differ by more than an order of magnitude. Electricity Maps, an independent provider of grid data, gives annual means for 2025 of 21.3 grams of carbon dioxide equivalent per kilowatt-hour for Sweden and 335.4 for Germany on its flow-traced basis, which includes electricity exchanged with neighbouring grids; on a production-only basis the figures are 19.0 and 362.5 (41, Electricity Maps, 2026). The same work done in Sweden and in Germany therefore carries about sixteen times the operational emissions in the German case, using the flow-traced means. The pages do not say whether the figures include lifecycle emissions of generation, so the book calls them Electricity Maps flow-traced means and does not compare them with figures that use other factors. Chapter 17 treats place and time.
Location-based and market-based
The second difference arises from accounting, and it is larger than most readers expect. Under the Greenhouse Gas Protocol a company reports its purchased electricity in two ways. The location-based figure applies the average grid factor where the electricity is used. The market-based figure applies the factor implied by the company's contracts, such as power purchase agreements and certificates called guarantees of origin, so that renewable electricity bought on an annual basis can reduce the figure whatever the grid delivered in a given hour.
The two hyperscaler reports of 2026 show the gap. Google reported for 2025 Scope 2 emissions (those from purchased electricity) of 15,148,700 tonnes location-based, up 37 per cent on 2024, and 2,815,000 tonnes market-based, down about 3 per cent; it matched 100 per cent of its electricity with renewable purchases on an annual basis and reported a global hourly carbon-free energy share of about 65 per cent, flat on 2024 (43, Google, 2026). Microsoft reported for its fiscal year to June 2025 Scope 2 emissions of 12.03 million tonnes location-based and about 2.7 million tonnes market-based (44, Microsoft, 2026). Both are vendor-reported, global and for the whole company, and neither separates AI from other cloud load. Neither figure is wrong. The location-based figure says what the grids that supplied the data centres emitted; the market-based figure says what the company's contracts imply. The ratio between them, about 5.4 for Google and about 4.5 for Microsoft, is a measure of how much of the claimed reduction rests on annual matching and not on hour-by-hour supply.
The Commission makes the same point for Europe: more than 70 per cent of the sites that reported match 100 per cent of their electricity with renewable energy on an annual basis, often through power purchase agreements and guarantees of origin that are "not necessarily connected to local production or new additions of renewable production" (11, European Commission, 2026). The accounting question is part of the footprint, not a footnote to it. Chapter 22 returns to claims, and Chapter 17 to hourly matching. Here the rule is that any carbon figure states whether it is location-based or market-based, and that a figure that does not say so is incomplete.
The size of the climate effect
The share of global emissions is small on current evidence and is concentrated in time and place: on the IEA's modelling data-centre emissions remain a small fraction of electricity-sector emissions to 2035 (38, IEA, 2026). Two qualifications keep that from being a reason for calm. Location matters, because a constrained regional grid such as Ireland's, with nearly a quarter of its metered electricity going to data centres, feels the load as a system problem. And hyperscaler reports show that the growth of AI electricity use has, for now, outrun the decarbonisation of its supply on the location-based measure; Google, whose 2026 report records an 18 per cent rise in its total ambition-based emissions for 2025, writes that reaching its climate moonshot is getting harder (43, Google, 2026).
Water
Water is the least well measured of the four. Three definitions are in use side by side, and a source rarely says which. Withdrawal is water taken from a river, aquifer or mains supply; consumption is the part that is not returned, mostly by evaporation in cooling; and total water adds the water consumed in generating the electricity. A figure can also be per kilowatt-hour of IT energy, per prompt or per site per year.
The Commission's WUE of 0.58 litres per kilowatt-hour of IT energy measures, by its own definition, total water input to the site, not consumption. The screening excluded sites that reported no water (the footnote names those relying on dry cooling), which is likely to push the mean upwards (the chapter's inference), and the number of sites with reliable WUE values (458 for the figure quoted) differs from the number used elsewhere in the report (11, European Commission, 2026). The national averages run from 0.07 to 1.28, which reflects climate, cooling design and facility size more than efficiency of operation.
At the level of a model, the paper that made water visible, by Li and colleagues, estimated that training GPT-3 in Microsoft's United States data centres could directly evaporate 700,000 litres of clean freshwater, and projected global AI demand at 4.2 to 6.6 billion cubic metres of water withdrawal in 2027. The boundary is operational, covers the electricity generation as well as on-site cooling, and the 2027 figure is a projection for withdrawal, not consumption (54, Li et al., 2023). Google, in its 2026 report, restates a median water consumption of 0.26 millilitres for a Gemini Apps text prompt in May 2025, based on a 2024 fleet-average WUE (43, Google, 2026). Mistral reports 45 millilitres of water for a 400-token response in a lifecycle analysis, dated only for its training figures and excluding the user's terminal (45, Mistral AI, 2025). The two prompt-level figures differ by a factor of about 170. The boundaries differ (water consumed in serving, against a lifecycle indicator) and are not published at a common boundary, so a reader cannot tell how much of the gap is boundary. That is the point of this chapter in one example. Chapter 7 treats water in detail, including water stress by region.
Materials and hardware
Hardware is where lifecycle and operational figures part company. Embodied emissions are those released before a server runs: mining, refining, fabrication, assembly and transport. NVIDIA's product carbon footprint summary reports 1,312 kilograms of carbon dioxide equivalent, cradle to gate, for one HGX H100 eight-accelerator baseboard, with materials and components accounting for 91 per cent and the memory, integrated circuits and thermal components the largest parts (46, NVIDIA, n.d.). The boundary matters in both directions. It is a baseboard, not a server, and it excludes host processors, networking, buildings, use and end of life, so it understates the embodied emissions of a complete installation. It is also commissioned by the manufacturer. Google's life-cycle assessment of five generations of its own accelerators reports both embodied and operational emissions per chip, on market-based and location-based accounting, and introduces a metric, compute carbon intensity, which improved threefold between the TPU v4i and the TPU v6e. The same paper shows that the share of embodied emissions in the lifetime total depends on the electricity accounting chosen, so that the choice made in the previous section reaches into the hardware question (55, Schneider et al., 2025).
Independent lifecycle data for accelerators are scarce, since the published values come from manufacturers or a vendor's own research group, and the useful life that a buyer assumes changes the embodied emissions allocated to each year by a large factor. Chapters 7 and 16 treat materials, e-waste and lifetimes. This chapter concludes only that embodied emissions are real, that the available figures are vendor-reported and partial, and that their share rises as electricity becomes cleaner.
Measured, modelled, projected, asserted
A figure has a provenance as well as a boundary. Four classes are used throughout the book. A measured figure comes from instruments on the system it describes. A modelled figure is calculated from a model of the system, with assumptions. A projected figure extends a model into the future. An asserted figure is stated without a method that a reader can inspect. Table 2.2 classes the principal figures of this chapter.
Table 2.2: Principal figures of the chapter by provenance. All sources retrieved in November 2026.
| Figure | Boundary and year | Source and kind | Class |
|---|---|---|---|
| 485 TWh, data-centre electricity | World, all data centres, total facility electricity; 2025 | IEA; independent | Modelled from capacity, utilisation, PUE |
| About 950 TWh, data-centre electricity | World, Base Case; 2030 | IEA; independent | Projected; range 833 to 1,008 TWh across cases |
| 68 TWh, data-centre electricity | EU, as cited by the Commission from outside bodies; 2024 | Commission; independent of operators | Modelled; reported sample is 36 per cent of sites |
| 7,663 GWh, 23 per cent of metered electricity | Ireland, metered, data centres found by name search; 2025 | CSO; independent | Measured, with a classification caveat |
| 8,200 MW in connection queue | Sweden, applied-for consumption until reserved; 1 November 2026 | Svenska kraftnät; independent | Counted; not demand, not consumption |
| 239 to 295 TWh, AI-built data centres | World, AI-built data centres; 2030 | Chen et al.; independent (academic) | Projected |
| 0.24 Wh per median text prompt | Accelerators, host, idle machines, overhead; excludes networking, devices, training; May 2025 | Google; vendor | Measured in production, not independently verified |
| 0.31 Wh per median query | Eight-accelerator node power times PUE, steady state, frontier-scale models; 2026 | Oviedo et al. (Microsoft); vendor-authored | Modelled |
| 15.1 Mt and 2.8 Mt, Scope 2 | Whole company, location-based and market-based; 2025 | Google; vendor | Reported |
| 1,312 kg CO2e | One HGX H100 baseboard, cradle to gate; n.d. | NVIDIA; vendor | Calculated by lifecycle assessment |
The independent figures describe the total or a country; those for one prompt or one chip come from the providers, who hold the data. A buyer should ask for the boundary in writing and state that a vendor figure is vendor-reported.
Two figures that disagree
The most cited quantity of the debate is the energy of one prompt. Three carefully made figures exist.
Google's paper, by Elsworth and colleagues, reports that the median Gemini Apps text prompt consumed 0.24 Wh at a comprehensive boundary in May 2025, composed of 0.14 Wh for the active accelerator, 0.06 for host processor and memory, 0.02 for idle machines and 0.02 for data-centre overhead. At the narrower boundary of earlier practice, which counts active accelerators only and takes the most efficient 10 per cent of sites, the same paper reports 0.10 Wh (51, Elsworth et al., 2025). Google reports the carbon of the median prompt as 0.03 grams of carbon dioxide equivalent on a market-based basis with a 2024 fleet-average factor, and the report's endnotes say that the estimates have not been independently verified (43, Google, 2026). The 2026 report repeats these figures and contains no new per-prompt measurement.
Oviedo and colleagues at Microsoft, in Joule in August 2026, estimate a median of 0.31 Wh per query, with an interquartile range of 0.16 to 0.60 Wh, for frontier-scale models above 200 billion parameters, and conclude that widely cited estimates are overstated by four to twenty times. The boundary is the steady-state power of an eight-accelerator H100 node (modelled at about 70 per cent of its maximum draw) multiplied by PUE, under large-scale deployment assumptions, with a median of 300 output tokens. It is a bottom-up model, not a measurement, and orchestration, tool calling and long-context overhead are out of scope. For queries with long reasoning outputs, of about 5,000 output tokens, the same paper models a median of 3.91 Wh, thirteen times higher (52, Oviedo et al., 2026).
Mistral, with a consultancy and the French environment agency, published a lifecycle assessment of its Mistral Large 2 model: 1.14 grams of carbon dioxide equivalent and 45 millilitres of water for a 400-token response, excluding the user's terminal, with the study peer-reviewed by two named firms. The page dates only its training figures, mentions a location-based approach only as a principle for future audits, and gives no energy figure for the response that can be set beside the other two (45, Mistral AI, 2025).
These figures differ by an order of magnitude on the surface, and each is defensible. Within Google's own paper the same prompt is 0.10 Wh or 0.24 Wh depending on the boundary, a factor of 2.4. The Google and Microsoft medians, 0.24 against 0.31 Wh, differ by a small factor once production measurement in a fleet is set against modelled node power. Between the median and the reasoning query the factor is 13 inside one paper. A buyer who reads "0.3 Wh per prompt" and "several watt-hours per query" sees a conflict where there is a change of task, and one who compares the Mistral carbon with the Google carbon sets a lifecycle figure beside an operational, market-based one. The response is to record, for the use in question, which difference applies, and not to choose a figure.
Practical guide: reading a figure
Purpose. Establish, in five minutes and before any figure is used in a decision, a report or a procurement document, what it counts and whether it can be set beside another.
Roles. Sustainability lead (owns the check and the record), FinOps or GreenOps practitioner (supplies unit and volume), procurement officer (asks the supplier the open questions), auditor (reads the record).
Inputs. The figure and its source document, not a summary of it, and the use case whose footprint is to be estimated.
Steps.
- What is counted? State whether the figure is operational or lifecycle, and whether it covers training, inference or both.
- Which equipment? State whether it covers active accelerators, the whole node or the whole facility, and whether idle and reserved capacity is included.
- Which electricity accounting and which water? State whether carbon is location-based or market-based, and whether water is withdrawal or consumption, on-site or total.
- Which statistic and unit? State median or mean, the unit (prompt, task, enquiry, agent run), the period and the length or complexity of the work.
- Who produced it and how? State whether it is measured, modelled, projected or asserted, whether it is vendor-reported or independent, and the retrieval date.
- What does it exclude, and with what is it comparable? List the exclusions and name the figures at the same boundary; write "none" where there are none, and do not compare outside that list.
Artefact. A figure check, kept with the source in version control and dated. Its evidence age is stated in the record: 12 months for a vendor-reported figure, 90 days for a measured figure of a running use, the reporting year for a claim.
figure_check:
  id: FCK-2026-001
  figure: median Gemini Apps text prompt, energy
  value: 0.24
  unit: Wh per median text prompt
  source: Google, Elsworth et al., arXiv 2508.15734 (August 2025); Google 2026 Environmental Report (June 2026)
  retrieved: 2026-11
  answers:
    q1_what_is_counted: operational electricity, inference only
    q2_equipment: active accelerator, host CPU and memory, idle machines, data-centre overhead
    q3_electricity_accounting: not applicable to energy; the carbon figure is market-based
    q4_water: consumption, 0.26 mL, 2024 fleet-average WUE
    q5_statistic: median, fleet-average utilisation, prompt length undefined, period May 2025
    q6_provenance: vendor-reported, measured in production, not independently verified
  excluded: [external networking, end-user devices, model training, data storage]
  comparable_with: [figures at the same boundary only]
  not_comparable_with: [per-enquiry figures, GPU-only benchmarks, lifecycle figures]
  valid_until: 2027-11   # vendor-reported figure, 12 months from the check of 2026-11
Definition of done. Every figure that enters a decision, a report or a tender has a check, its exclusions are written down, and the comparison list is not empty only where a comparison was intended.
Worked example: the same enquiry counted at three boundaries
Illustrative example; the figures of Nordvik Region are illustrative and not data. The Region's citizen-service assistant on reserved accelerators had a calculation for October 2026 of 1,970 kWh of GPU and host energy for 71,000 resolved enquiries, a PUE of 1.15 and a location-based grid factor of 32 grams per kilowatt-hour, with 62,400 grams of allocated embodied emissions (AI Platform and Security, Chapter 22) (27, Nordqvist, 2026). The functional unit is one resolved enquiry, which spans several model calls and a retrieval step, not one prompt. Assume, for the first boundary only, that accelerators account for 0.70 of node energy; the Region did not meter that split, and the figure is an assumption.
Table 2.3 sets out the five counts.
Table 2.3: One resolved enquiry at five boundaries (illustrative; Nordvik Region, October 2026 calculation).
| Boundary | Energy per resolved enquiry | Carbon per resolved enquiry at 32 g/kWh |
|---|---|---|
| Active accelerators only (assumption: 0.70 of node energy) | 19.4 Wh | 0.62 g |
| Whole node, GPU and host (1,970 kWh divided by 71,000) | 27.7 Wh | 0.89 g |
| Whole facility (node energy times PUE 1.15) | 31.9 Wh | 1.02 g |
| Facility plus allocated embodied emissions (62,400 g divided by 71,000) | 31.9 Wh | 1.90 g |
| Same facility boundary on a grid at 350 g/kWh | 31.9 Wh | 11.2 g |
The same enquiries give a carbon figure of 0.62 grams or 1.90 grams, a factor of 3.1, with no change in the system. The grid line shows that location moves the figure by a factor of 11 within one boundary. A reader who then set the 31.9 Wh per enquiry beside the 0.24 Wh per prompt of Google's paper would find a factor of about 130 and could conclude that the Region's system is wasteful. The comparison is invalid on three counts: an enquiry is several calls and not a prompt, the Region's pool includes reserved accelerators that wait for load, and the two boundaries differ. What the figure supports is a plan to measure the three differences in the Region's own system, which is the work of Chapter 6.
What is not known
The gaps bear on decisions. The electricity of AI, as distinct from all data-centre electricity, is not published by any operator; the closest independent estimates are the IEA's AI-focused subset and the projection of Chen and colleagues, and they rest on models. No provider has published the total inference energy of a service over time, so that whether efficiency gains per prompt are outrun by volume cannot be shown from provider data. Google reports a large fall in energy per median prompt over a year and a 37 per cent rise in total electricity in 2025, which is consistent with growth outrunning efficiency but does not demonstrate it, because one is a median per prompt and the other a company total (43, Google, 2026). Chapter 10 returns to this. No 2026 per-query disclosure from other large providers of general-purpose models was found in the sources read for this chapter, and the Commission's data cover about a third of the sites in scope. No source gives water by workload, and no independent lifecycle data for current accelerators were found.
What the evidence allows us to say about the future
Statements about the future carry the labels of AI Governance, Chapter 22 (26, Nordqvist, 2026). It is observable that data-centre electricity grew by 17 per cent in 2025, that AI-focused data centres grew by 50 per cent, and that measured per-prompt energy at one provider fell sharply in a year. It is expected, on the IEA's Base Case and the Commission's adoption of a similar path for Europe, that data-centre electricity roughly doubles by 2030, with the stated range of cases; and it is expected that more standardised disclosure follows from the Union's reporting and from standards in preparation, which Chapters 8 and 21 treat. It is speculation to name a point value for 2030 or 2035, because the IEA itself ties the figure to capital-market sentiment and marks its 2035 values as exploratory, and it is speculation that efficiency per prompt will continue to fall at the pace of the last year, since the sources report one year of measurement at one provider. The author's projections are kept to Chapters 25 and 29.
What this means for the buyer
Uncertainty is neither a reason for inaction nor a licence for false precision. The evidence supports four conclusions, which are the book's own.
First, the aggregate is large enough to matter and small enough to place in context. Data-centre electricity is about 485 TWh and growing at 17 per cent a year, but it is under 10 per cent of the growth in global electricity demand to 2030 on the IEA's modelling, and its effect is local and concentrated.
Second, the footprint of a use is a product of three factors the buyer can partly control: energy per unit of work, the carbon and water intensity of the place and time, and the volume. The first two vary by an order of magnitude or more between honest choices, and the third is the buyer's decision. Chapters 12 to 17 work through the levers.
Third, a provider's figure is a claim with a boundary: a request for "the footprint per prompt" receives an answer at whatever boundary the provider chooses. The AI Act asks providers of general-purpose AI models to document training energy (1, European Union, 2024), and the Code of Practice model documentation form asks for it too (9, European Commission, 2025), but a deployer has no direct energy duty and the form does not ask for inference energy, so a buyer who wants the figure must write the request and the boundary into the contract. Chapter 23 gives the clause.
Fourth, evidence has an age: the Region's calculation of October 2026 describes a service of different volume, and a figure check records the date so that the age is visible.
The three tests of the net-benefit principle can be read against this chapter. Count is possible at each boundary but only where the boundary is chosen and stated. Compare and Cap cannot be passed on the evidence of this chapter, because benefit, rebound and budgets are the subject of later chapters. The chapter therefore establishes only the first of the three.
Across the modes and the organisations
Across the usage modes
The series' usage modes (AI Governance, Chapter 2) (26, Nordqvist, 2026) differ by an order of magnitude in volume and, more importantly for measurement, in what the buyer can see.
Table 2.4 shows what the buyer can see in each mode.
Table 2.4: What drives the footprint, and what the buyer can see, by usage mode.
| Mode | What drives the footprint | What the buyer can see | Evidence the buyer can obtain |
|---|---|---|---|
| Mode 0 Ambient AI | Always-on features inside licensed software | Nothing at use level | A supplier statement at best; a supplier-reported row |
| Mode 1 Conversational assistants | Prompts through an enterprise tier | Seats; message counts if reported | Provider per-prompt figures with boundary; energy only if asked |
| Mode 2 Embedded workplace assistants | Calls per user action in a work tool | Licence and usage reports | As Mode 1, plus the supplier's disclosure |
| Mode 3 Agentic work tools | Multi-step tasks, long context, tool calls | Task counts; tokens per task if logged | Energy per task, not per prompt; modelled estimate is the norm |
| Mode 4 Built AI applications | Requests through the organisation's gateway | Requests, tokens, utilisation, cost | Measured power on own hardware; token-based estimates for hosted routes |
| Mode 5 Autonomous production agents | Work the agent starts itself | Runs, retries, tool calls, spend | Energy per successful goal; needs a budget and an outside stop path |
Volume sits mostly in Modes 4 and 5, and visibility is lowest in Modes 0 to 2. Where an agent takes part in measurement, it measures and reports; it does not provision its own compute or disable the measurement, the budget or the stop path, which is a Level 4 prohibition of the series that Chapters 15 and 20 apply.
Nordvik Region and Hansa Mutual
Nordvik Region uses the providers' published figures in its public statements about the citizen-service assistant without the boundaries behind them, and the Region's own figure of October 2026 (1.90 grams per resolved enquiry) has aged and excluded the hosted large-provider route (illustrative). Applying the figure check shows what the figures cannot answer: they do not say whether the unit is an enquiry or a prompt, whether idle reserved capacity is in the count, or which electricity accounting a public statement used. Because Swedish public-access rules make the Region's records requestable, the figure checks are written so that they can be read in public, and the reading record below is the first of them.
reading_record:
  id: RDG-NR-2032-09-01
  status: illustrative
  organisation: Nordvik Region
  service: citizen-service assistant, open-weight generation route
  functional_unit: resolved enquiry
  period: 2026-10          # month of the last documented calculation (aged)
  energy_wh_per_unit:
    gpu_only: 19.4          # assumption: GPU share of node energy 0.70
    gpu_and_host: 27.7      # 1,970 kWh / 71,000 enquiries
    with_facility_overhead: 31.9   # PUE 1.15 as in the calculation
  grid_factor_g_per_kwh: 32 # location-based
  carbon_g_per_unit:
    operational_gpu_only: 0.62
    operational_node: 0.89
    operational_facility: 1.02
    with_allocated_embodied: 1.90
  excluded: [hosted large-provider route, end-user devices]
  evidence_age_months: 71
  action: re-measure before any figure is quoted outside the Region
Hansa Mutual has the opposite problem. Its internal accelerator estate in the Frankfurt data centre (hansa-dc-frankfurt, PUE about 1.38, 96 accelerators at average utilisation 0.52, illustrative) gives a facility-level figure that nobody has compared with a provider's per-prompt figure. In an illustrative month of September 2032 the metered platform racks drew about 62 MWh, which at PUE 1.38 is about 85.6 MWh at the facility boundary, and the platform served about 3.4 million requests across all its uses, or about 25 Wh per request at the facility boundary including idle capacity. That figure is not comparable with 0.24 Wh per prompt, for the same reasons as the Region's, and a location-based factor of 350 grams per kilowatt-hour gives about 8.8 grams per request on the group's profile, while its market-based figure, with guarantees of origin bought annually, would be far lower. The group's sustainability lead, Dr. Verena Lindner, decides first to record the location-based and the market-based figure side by side, so that neither is quoted alone. All Hansa Mutual figures here are illustrative.
Summary
The evidence of November 2026 supports a clear picture and a list of unknowns. Data centres used about 485 TWh of electricity in 2025 on the IEA's boundary, growing 17 per cent in the year, and the IEA's central projection to 2030 is about 950 TWh, with a range of 833 to 1,008 TWh across its four cases. In Europe the first measured reporting under the Energy Efficiency Directive covers about 36 per cent of the sites in scope. Concentration is the sharper fact: Ireland's data centres took 23 per cent of metered electricity in 2025, and Sweden's connection queue passed 8,200 MW, a count of applications and not of demand. The IEA now says that growth will be sensitive to market sentiment and financing as well as to grids, chips and permits.
Carbon figures depend on grid and on accounting, water is measured with incompatible definitions, and materials are covered by vendor-reported and partial data. Two honest figures can differ by an order of magnitude, and the cause, as in 0.10, 0.24, 0.31 and 3.91 Wh or 0.62 and 1.90 grams, is almost always a boundary.
The chapter concerns E1 Measure and passes only the first of the three tests of the net-benefit principle, Count, and only where the boundary is chosen. Its practical result is the figure check, the six questions asked of every number, and a habit of recording the boundary, the date and the provenance. Chapter 3 turns to the other side of the ledger, what AI can do for the environment and how much of it is shown. Chapter 4 then defines the method that joins the two sides.
Sources
- European Parliament and Council of the European Union. (2024). Regulation (EU) 2024/1689 laying down harmonised rules on artificial intelligence (Artificial Intelligence Act). Official Journal of the European Union, 12 July 2024. (1, European Union, 2024)
- European Parliament and Council of the European Union. (2023). Directive (EU) 2023/1791 on energy efficiency (recast). Official Journal of the European Union, 20 September 2023. (5, European Union, 2023)
- European Commission. (2025). The General-Purpose AI Code of Practice. European AI Office, 10 July 2025. (9, European Commission, 2025)
- Nordqvist, G. (2026). AI Governance: Governing Artificial Intelligence in European Enterprises and Public Authorities. The Transformed Architecture, Book 2. (26, Nordqvist, 2026)
- Nordqvist, G. (2026). AI Platform and Security: Building and Securing AI Platforms in European Enterprises and Public Authorities. The Transformed Architecture, Book 3. (27, Nordqvist, 2026)
- Nordqvist, G. (2026). AI Threat: Are the Dystopias Coming True? Evidence, Risk and Response for European Enterprises and Public Authorities. The Transformed Architecture, Book 5. (29, Nordqvist, 2026)
- International Energy Agency. (2026). Key Questions on Energy and AI. World Energy Outlook Special Report, April 2026, retrieved November 2026. (38, IEA, 2026)
- European Commission. (2026). Report on the energy efficiency of data centres in the EU. COM(2026) 500 final, 21 September 2026, retrieved November 2026. (11, European Commission, 2026)
- Google. (2026). 2026 Environmental Report. Google LLC, 30 June 2026, retrieved November 2026. (43, Google, 2026)
- Elsworth, C. et al. (2025). Measuring the environmental impact of delivering AI at Google Scale. arXiv:2508.15734, retrieved November 2026. (51, Elsworth et al., 2025)
- Oviedo, F. et al. (2026). Energy use of AI inference, efficiency pathways, and test-time scaling. Joule 10(8), August 2026, retrieved November 2026. (52, Oviedo et al., 2026)
- Chen, D. et al. (2026). Artificial intelligence data centers could reach one percent of global electricity demand by 2030. Communications Sustainability 1, 147, retrieved November 2026. (53, Chen et al., 2026)
- Li, P., Yang, J., Islam, M. A. and Ren, S. (2023). Making AI Less "Thirsty": Uncovering and Addressing the Secret Water Footprint of AI Models. arXiv:2304.03271 (v5, March 2025; accepted by Communications of the ACM), retrieved November 2026. (54, Li et al., 2023)
- Svenska kraftnät. (2026). Information om pågående anslutningsärenden. Statistics as at 1 November 2026, retrieved November 2026. (39, Svenska kraftnät, 2026)
- Central Statistics Office (Ireland). (2026). Data Centres Metered Electricity Consumption 2025. Retrieved November 2026. (40, Central Statistics Office (Ireland), 2026)
- Electricity Maps. (2026). Electricity Grid Review 2025: Sweden and Germany. Retrieved November 2026. (41, Electricity Maps, 2026)
- Microsoft. (2026). 2026 Environmental Data Fact Sheet. Microsoft Corporation, fiscal year 2025, retrieved November 2026. (44, Microsoft, 2026)
- Mistral AI. (2025). Our contribution to a global environmental standard for AI. 22 July 2025, retrieved November 2026. (45, Mistral AI, 2025)
- NVIDIA. (n.d.). Product Carbon Footprint (PCF) Summary for NVIDIA HGX H100. Retrieved November 2026. (46, NVIDIA, n.d.)
- Schneider, I. et al. (2025). Life-Cycle Emissions of AI Hardware: A Cradle-To-Grave Approach and Generational Trends. arXiv:2502.01671, retrieved November 2026. (55, Schneider et al., 2025)