The Benefit Side: What AI Can Do for the Environment and How Much Is Shown
Chapter 2 counted what AI costs the environment and said how far each figure can be trusted. This chapter does the same for the other side of the ledger: what AI is used for to the benefit of the environment, how much of that benefit has been shown by measurement in a running deployment, and how much is modelled, projected or only asserted. It concerns E2 Justify, the function that decides whether a use is worth its footprint, because a justification can be no better than the evidence on its benefit side. It supplies the evidence grade that the second test of the net-benefit principle, Compare, needs (Chapter 4). The chapter neither inflates the benefit nor dismisses it. It grades it with the discipline that Chapter 2 applied to energy and water, and it ends by stating that the benefit is a separate ledger, which Chapter 9 compares with the footprint of a use. Figure 3.1 shows the four grades.
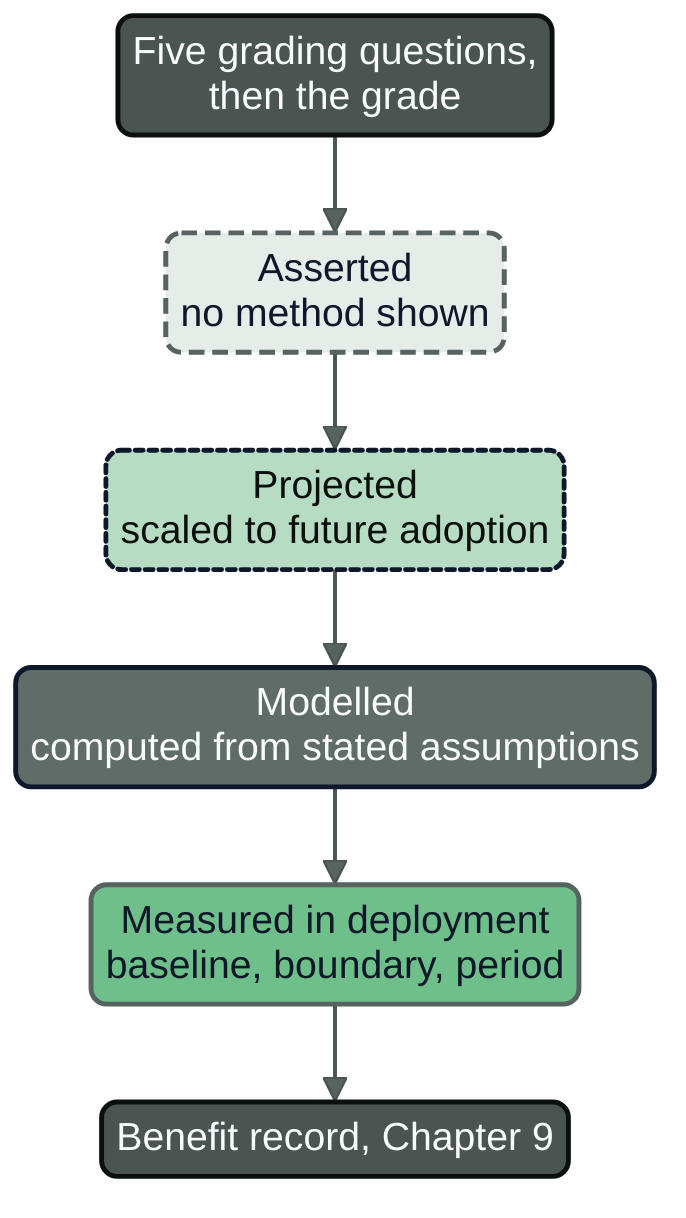
Figure 3.1: The four evidence grades for a benefit claim, from asserted to measured in deployment. A claim moves down the figure only by adding method, a stated baseline and a check; the grade is a property of the evidence, not of the application.
A claim in a sustainability report
Imagine the draft of an annual report in September 2032. A sentence in the section on digital services reads: "Our AI-assisted route optimisation reduces the emissions of regional public transport." The sentence is plausible. Route optimisation is an old and well-understood technique, and a model that proposes better timetables or better vehicle rotations could in principle save vehicle kilometres. Nobody reading the draft doubts the direction of the effect.
A reviewer asks five things, and the draft answers none of them. Reduced by how much, and counted in what unit (vehicle kilometres, fuel, grams of CO2e)? Reduced compared with what: last year's timetable, the spreadsheet method the planners used before, or no change at all? Over which period and on which lines? Measured by whom, or computed from which model? And is the footprint of the AI system itself inside the figure, or outside it? A reader who cannot find these answers cannot tell a measured saving from a hope, and neither can the people who signed the report.
This is the situation of most benefit claims in most organisations. The claim above belongs to the illustrative Nordvik Region and is graded in a worked example later in the chapter. The chapter builds the tools to grade it: a catalogue of where AI helps, four evidence grades, a reading of the best-known estimates and of a systematic critique, and five questions with a sixth step that records the grade.
Where AI helps
The standard catalogue of possible uses is the survey by Rolnick and colleagues, first published as a preprint in 2019, which reviews how machine learning could help to reduce greenhouse gas emissions and to adapt to a changing climate, in areas from smart electricity grids to disaster management (68, Rolnick et al., 2019). It is a catalogue of opportunities and open research questions and does not claim that any has been realised at scale: the right starting point for a list, the wrong one for a number.
Six families of use recur in the sources this chapter read, and they are the families that an enterprise or public authority meets.
- Energy systems and grids. Forecasting the output of wind and solar generation and the demand of customers, and operating grids and storage so that more renewable electricity is used and less is curtailed (switched off because the grid cannot take it). Stern and colleagues, discussed below, assume that AI can raise the load factor of solar and wind (the share of the time that installed capacity actually produces) by up to 20 per cent (61, Stern et al., 2025).
- Buildings. Predicting heating, cooling and ventilation demand and adjusting set-points, so that a building uses less energy for the same comfort.
- Industry and data centres. Controlling processes and, as a special case, the cooling of data centres themselves.
- Transport and logistics. Routing, scheduling, shared mobility and the adoption of electric vehicles.
- Food, land and nature. The development of alternative proteins and the monitoring of land, forests and leaks.
- Forecasting and monitoring generally. Weather and climate forecasting, satellite detection of emissions and early warning.
Two cautions apply. Most of the application evidence concerns traditional AI (predictive models, optimisation, computer vision), not the large generative models that dominate public attention: the critique read below found that 97 per cent of the climate-benefit claims it coded concerned traditional AI (63, Joshi, 2026), and the footprint of the two differs by orders of magnitude (Chapter 2). And a technique can serve the environment in one place and harm it in another ("What the models say").
The evidence grades
A claim of benefit is a statement about the world, and statements about the world differ in how directly they were observed. This book grades a benefit claim on four levels. The levels describe the evidence behind the claim, not the importance of the application, and a claim may be true at any grade; the grade says how far a reader may rely on it.
Table 3.1 defines the four grades, from the weakest evidence to the strongest.
Table 3.1: The four evidence grades for a benefit claim.
| Grade | What it means | What a reader may conclude | Typical example |
|---|---|---|---|
| Asserted | A statement of effect without a method a reader can inspect | Nothing beyond the claimant's belief | A figure repeated from a report that cannot be traced |
| Projected | A measured or modelled per-unit effect scaled to a future date or wider adoption by assumption | That the effect could reach this size if adoption reaches the assumed level | A national or global saving in 2035 under assumed adoption |
| Modelled | An effect computed by a model or simulation from stated assumptions | That the effect follows if the assumptions hold: a potential, not an outcome | A general-equilibrium model of fossil-fuel and renewable productivity gains |
| Measured in deployment | An effect observed in a running use, against a stated baseline, boundary and period | That the effect occurred there, under those conditions | A control system's energy use against the same plant before, in kWh per unit of cooling |
Three rules make the grades usable.
The grade is the lowest link in the chain. A claim that rests on a measured saving in one building and an assumption that every building behaves alike is a projection, because the assumption carries the number. Grading therefore follows the weakest part of the argument from observation to the stated figure.
A baseline is part of the grade. A measured reduction without a baseline is a number, not a claim. The baseline says what would have happened without the AI use: the same plant before the change, a matched group that did not get it, or the cheapest non-AI method that was available. A claim that states no baseline is graded asserted whatever its precision, and Chapter 9 treats baselines in full. This applies the net-benefit principle of Chapter 4 on its second test, Compare: the benefit is set against the non-AI alternative and against the rebound the use causes. The grade only records whether the evidence for the benefit side of that comparison exists.
Independence is recorded beside the grade, not inside it. A measured result reported by the operator of the system is still a measured result, and it is also vendor-reported. The record keeps both facts, so that the reader can weigh a measurement that has been checked by someone else more heavily than one that has not. This follows the series' rule that a vendor's figure is read as a claim by an interested party (AI Leader, Chapter 20) (35, Nordqvist, 2026), and the benefits practices of AI Governance, Chapter 16A: separate realised benefits from forecasts, record assumptions and confidence, and do not scale on adoption alone (26, Nordqvist, 2026).
What the evidence looks like, domain by domain
The sources below were opened at the primary page or document in November 2026. For each, the text gives the grade, the baseline, the boundary and who reported it. The cases were chosen because their evidence could be read; they are not a survey of the field.
Weather forecasting: a large energy saving and a mixed skill result
The European Centre for Medium-Range Weather Forecasts (ECMWF), an intergovernmental organisation supported by European states, made its ensemble AI forecasting system operational in 2025. Its news release of 1 July 2025 states that the system reduces energy consumption "by approximately 1,000 times" and runs "over 10 times faster" than the physics-based forecasting system it runs alongside (the Integrated Forecasting System, IFS), and that it outperforms physics-based models on many measures, including surface temperature, with "gains of up to 20%" (64, European Centre for Medium-Range Weather Forecasts, 2025). The release also states that the AI ensemble runs at a lower resolution (31 km) than the physics-based ensemble (9 km).
Read with the grading questions, the energy claim is the operator's own estimate. The release gives neither method nor boundary: it does not say whether training is included, and the comparator differs in resolution. The claim comes from a public body and is plausible, but until the method is published it grades as asserted by the operator, credible on its face. The ratio concerns the energy of producing a forecast, not an environmental benefit. A forecast saves emissions only when someone acts on it differently, and no saving of that kind is claimed.
The skill claim has since been tested by others. Kocsis and Baran compared the AI ensemble and the physics-based ensemble for 10-metre wind speed at more than 9,000 weather stations worldwide from July to November 2025, in a preprint of 1 June 2026 that has not been peer reviewed as far as this chapter could determine (65, Kocsis & Baran, 2026). The raw physics-based forecasts were substantially more skilful at all lead times, statistical post-processing narrowed the gap, and the remaining differences were mostly significant at short lead times, where the physics-based system still did better. The two findings are compatible: the AI system is better on some variables (the operator names surface temperature), the physics-based system on others (this study's wind speed). A sentence that says AI forecasting is a thousand times more efficient and more accurate combines an asserted claim with one that holds only for some variables.
Data-centre cooling: measured in deployment, vendor-reported
A data centre spends part of its energy on cooling, and controlling the cooling plant well is a well-bounded problem. In a post of 17 August 2018, Google and DeepMind staff described an autonomous cooling control that, after the first launch, showed a 12 per cent improvement and rose to about 30 per cent on average over about nine months, measured in kilowatts per ton of cooling against the historical baseline before the AI control (66, Gasparik et al., 2018). The post describes safeguards: the system rejects actions for which it has low confidence, actions are checked against constraints set by the data-centre operators and again by the local control system, the optimisation range was deliberately narrowed, and operators can switch back to on-site rules at any time.
This is the closest case to the top grade. It is a result measured in deployment with a stated baseline, boundary (cooling plant efficiency in kW per ton, in the company's own data centres) and metric. It is also vendor-reported by the company that operates the facilities and sells related services, it is eight years old at the retrieval date, it was not independently checked, and it concerns cooling plant, not the whole facility. It is also a pattern for Chapters 13 to 15: a controller acting within limits, with a stop path held by the operators. The grade promises a credible saving in the plant that was measured, and no more.
Buildings: a range, with a mixed evidence base
Building energy management systems regulate heating, ventilation, air conditioning and lighting. A topic brief of November 2025 from the American Council for an Energy-Efficient Economy (ACEEE) states that studies show that AI can reduce building energy use and carbon emissions by 8 to 19 per cent, and reports a meta-analysis of 87 education buildings over four years in Sweden in which AI-based HVAC solutions reduced district-heating consumption by 3.1 per cent and electricity consumption by 8.93 per cent (67, Srivastava, 2025). The brief was written for a Taiwanese research institute and is a secondary summary: its range aggregates studies with different baselines, the Swedish figure comes from a study this chapter did not open, and its references include vendor white papers.
The honest grade for the range is modelled and measured, mixed, aggregated across baselines: it supports the statement that savings of this order have been reported, and it does not support a statement that a particular building will save a particular amount. The Swedish result is the most relevant to a Swedish public authority and the least verifiable here. Chapter 9 explains what a building owner needs to turn the range into a claim: a baseline from the same building's metered use, normalised for weather, for a heating season before and a heating season after.
Power, food and transport: potentials, modelled and projected
The best-known quantification of AI's climate benefit in the peer-reviewed literature is a perspective by Stern, Romani, Pierfederici and colleagues in npj Climate Action, published 23 June 2025 (61, Stern et al., 2025). The authors estimate that in three sectors only, AI could reduce global emissions against a business-as-usual baseline by 3.2 to 5.4 gigatonnes of CO2-equivalent (GtCO2e) a year by 2035. The sector figures are 1.8 GtCO2e a year in power (from higher load factors of solar and wind, up to 20 per cent), 0.9 to 1.6 GtCO2e in meat and dairy in the AI scenario (1.7 to 3.0 GtCO2e in a highly ambitious scenario), and 0.4 GtCO2e from shared mobility in light road vehicles, with a further 0.2 GtCO2e from faster adoption of electric vehicles. The 2023 emissions of the three sectors are given as 15.3 GtCO2e for power, 8.7 for meat and dairy and 3.2 for light road vehicles. The authors compare the reduction with an estimated 0.4 to 1.6 GtCO2e a year of emissions from the electricity use of data centres and AI, calculated from three scenarios of AI roll-out and the International Energy Agency's grid-intensity scenarios.
The paper is explicit about its limits, and the limits determine its grade. It covers three sectors, considers direct effects, and states that it "does not consider any rebound effects such as efficiency gains in AI leading to increased consumption or unintended expansion of carbon-intensive processes". It describes earlier industry estimates (1.5 to 4 per cent and 5 to 10 per cent of emissions by 2030) as not peer-reviewed, not fully disclosed in method and produced by AI solutions providers. The authors declare no competing interests; the data are held at the consultancy Systemiq Ltd and available on request; the acknowledgements thank reviewers including staff of Google DeepMind and Alphabet.
The grade is projected, built on modelled per-sector potentials. It is a potential under assumed adoption, not an outcome, it concerns the sectors the authors chose, and by its own statement it omits rebound. It is also the best-founded such estimate this chapter could read. The sentence that follows from it is "in three sectors, AI could reduce emissions by a stated amount if adoption follows the stated scenario". The sentence that does not follow from it is "AI reduces global emissions by more than it causes".
Uses the chapter does not grade
For grid operation and curtailment, industrial optimisation, logistics, precision agriculture, forest and biodiversity monitoring, materials discovery and satellite detection of methane leaks, no measured-deployment study was read for this chapter, and the pages of two relevant organisations could not be retrieved. The chapter assigns no grade and states no figure; that is a finding about the chapter, not about the field. An organisation that wants to claim a benefit in one of these domains starts from the same five questions and the same four grades.
What the models say
Two kinds of model dominate the public discussion, and they point in different directions.
The International Energy Agency
The International Energy Agency (IEA) has published the most cited scenario of AI's contribution to climate goals, in Energy and AI (2025), which describes emission reductions from widespread adoption of existing AI applications in the end-use sectors. The text of that report's chapter on AI and climate could not be retrieved: the IEA website returned an access error to every automated route. Search summaries attribute to it a reduction of about 5 per cent of energy-related emissions in 2035, and a statement that the aggregate impact "could be marginal" if the enabling conditions are not created. Those figures were not read at the source, and the chapter does not state them as fact.
What was read is the April 2026 report Key Questions on Energy and AI (38, IEA, 2026). Two of its statements bear on the benefit side. It states that, measured per individual task, the energy efficiency of AI is improving at a rate unprecedented in energy history, with energy per task dropping by at least an order of magnitude annually in recent years, while new energy-intensive uses such as reasoning, video and agentic tasks can consume hundreds or thousands of times more energy per query than simple text generation. And it discusses an AI-driven boost to economic output in which higher activity does not necessarily translate into proportionally higher energy use; the report gives this as a qualitative finding, and this chapter states no figure for it. The report is the IEA's modelling and its own statements, not a measurement of benefit. Its first statement matters for Chapter 10: per-use efficiency can improve while total demand rises, which is the pattern that rebound analysis examines.
One model of the fossil-supply side
Stern and colleagues model the climate-solution side. A second peer-reviewed model asks what happens when AI raises productivity in fossil-fuel supply as well. W. Alpine, Geldner, H. Alpine and Chepeliev, in npj Climate Action (published 4 August 2026), model AI as a productivity amplifier in a global computable general equilibrium model, an economy-wide model that computes how prices, output and demand adjust across sectors, and they quantify both emissions enabled by productivity gains in fossil supply and emissions avoided by productivity gains in renewables (62, Alpine et al., 2026). Under parallel adoption scenarios, net annual CO2 emissions increase by 0.47 to 1.8 gigatonnes (1.2 to 4.8 per cent of 2024 global energy-related CO2 emissions). Enabled emissions exceed avoided emissions whenever the fossil-sector gains are nonzero, and net reductions require renewables gains four to five times greater than the fossil gains.
The paper's own declaration says that two of its authors are affiliated with the Enabled Emissions Campaign, a nonprofit research and advocacy project, as a non-financial competing interest, and that there is no financial competing interest. The grade is modelled: a stylised model with assumed productivity shocks, not a measurement, and the authors' scenarios are not forecasts. It is, as far as this research could find, the first peer-reviewed estimate of the sign of the fossil-supply effect, and it sits beside Stern rather than against it: Stern omits the supply-side effect, and this one models only the productivity channels. Neither is a net global ledger, and the two cannot be added. What the pair establishes is narrower and still useful: the net climate effect of AI depends on which applications are adopted and where, so a benefit claim about one application says nothing about the net effect of AI as a whole. For any benefit claim in the energy sector the practical question is who else gains productivity from the same technique, and in which direction.
What critics found
In February 2026 the analyst Ketan Joshi published, for Beyond Fossil Fuels with Friends of the Earth US, Stand.earth, the Green Screen Coalition, the Green Web Foundation and Climate Action Against Disinformation, The AI Climate Hoax (63, Joshi, 2026). The publishers are advocacy organisations, and the report says so by listing them; no funder is named in the document. The report is a systematic reading of how prominent institutions support one narrative: that AI will deliver a large net decrease in emissions that offsets the harm of its own growth.
Method
The author selected eight prominent sources published before 2025 (among them chapters of the IEA's Energy and AI, the Stern et al. perspective, a comment in Nature by a Microsoft sustainability scientist, Microsoft's 2023 sustainability playbook and Google's 2025 environmental report), searched in September and October 2025. He coded each statement that claimed AI would reduce emissions by the type of AI and by the type of evidence offered. Modelling exercises that estimate a net result in gigatonnes were excluded by design, so the analysis reads written claims only. The coding sheet is publicly accessible according to the report.
Findings
Of the 154 mitigation claims coded, 150 (97 per cent) concerned traditional AI such as predictive models and computer vision, and 4 (3 per cent) concerned consumer generative AI, all from Microsoft's 2023 playbook; the report finds no example in which a consumer generative system led to a verifiable and substantial emissions reduction. By evidence offered, 26 per cent of the claims cited published academic papers, 36 per cent cited no evidence, 29 per cent cited corporate publications and 8 per cent cited media, non-governmental organisations, institutions or unpublished papers. The report concludes that "the narrative of a gigatonne-scale shift in global emissions that 'offsets' the harm of generative AI is not supported by the results", and also that "these results do not suggest AI technologies will have no climate benefits", noting that many cited examples include real-world measured reductions.
Two cases in the report illustrate how claims fail. The statement that AI could mitigate 5 to 10 per cent of global greenhouse gas emissions by 2030, used by Google in a policy roadmap for the European Union and, according to the report, repeated as recently as April 2025, was traced by the author to a 2021 blog post of a consulting firm that extrapolated the figure from its experience with clients. Stern and colleagues independently describe the corresponding Google and consultancy study as not peer reviewed. The second case is a claim in Google's 2025 environmental report that a solar-mapping tool helped partners to reduce about 6 million tonnes of greenhouse gas emissions in 2024, around 6,000 times the approximately 1,000 tonnes the service itself emitted. The report notes that the 6 million tonnes is an estimate of the total emissions avoided by the rooftop solar installations in question, so the comparison gives the impression that all of their climate benefit is due to the AI image tool.
What the critique shows and what it does not
It shows that, in the eight sources it read, most claims of climate benefit rested on weak or no evidence, that they concerned traditional AI while the debate concerns generative AI, and that two prominent figures had no traceable analysis behind them. Its limits matter as much. The sample is eight prominent sources, mostly corporate or from the IEA, selected and coded by one author; later sources and modelled net estimates are excluded by design; the publishers are advocacy organisations. The finding is therefore not that 154 claims were false, or that AI has no climate benefit, and the report says neither. It is that the offset narrative lacks the evidence its repetition suggests. Two numbers from press coverage need correction: the ratio of traditional-AI to consumer generative claims is 38 to 1 by claim count (not 40), and a figure of "74 per cent unproven" does not appear in the report.
The three readings together
The Stern perspective, the Alpine model and the Joshi report are often presented as opposing camps, but they answer three different questions. Stern asks how large the potential is in three sectors if adoption follows a scenario, and omits rebound. Alpine asks what sign the effect has when the same productivity reaches fossil supply. Joshi asks how well the public claims are supported, and excludes models. None measures the net effect of deployed AI on global emissions, and none claims to. What all three allow is that the benefit is real in places, uneven, conditional on who adopts, and rarely measured as claimed.
A word this book does not use
Some sources name the benefit side by a single term that treats it as the mirror of the footprint. Neither the Stern perspective nor the Joshi report uses it, so this book does not introduce it. The metaphor suggests that the two sides are the same kind of quantity and may be summed, whereas a footprint is a measurement of resources consumed at a boundary and a benefit is a comparison with something that did not happen. It also invites the attribution error of the solar example, where the whole benefit of an activity is credited to the one tool that took part in it. The book keeps two ledgers with their own boundaries, and Chapter 9 compares them in a record that states both.
Benefit within reach
An enterprise or public authority rarely changes the global figures, and it does not need to. What it can do is own, measure and record the benefit of its own uses. Four conditions make a benefit claim fit for a benefit record (Chapter 9).
- The use displaces a physical activity or a resource the organisation controls. An energy forecast for the organisation's own buildings, a routing change in its own vehicle fleet or timetable, a reduction in site visits that its own staff would have made: each has an owner who can read the meter, the fuel card or the visit log.
- A baseline exists or can be made. The organisation can compare the same buildings before and after, or a pilot group with a control group, or the cheapest non-AI method.
- The unit of the benefit matches the unit of the footprint. If the footprint is counted per resolved enquiry (the unit of Chapter 6), the benefit is counted per resolved enquiry, so that the comparison is a ratio and not an assertion.
- The effect survives a rebound check. A saving in kilometres driven is real only if the kilometres were not spent again elsewhere (Chapter 10).
A use that meets these conditions can reach the measured-in-deployment grade within one season. A use that does not remains a projection or an assertion, and the report should say so in the same sentence as the claim. In Sweden the Region's records of an AI use are requestable under the public-access rules unless classified, so a claim should be one that can be read in public with its method beside it.
Practical guide: grading a benefit claim
Purpose. Assign one of the four grades to a benefit claim before it is repeated in a report, a procurement document or a business case, and write down what would raise the grade.
Roles. The sustainability lead owns the grade; the owner of the use supplies the evidence; the finance function checks the baseline when cost is involved; the legal counsel reviews a claim before publication (the publication of an environmental claim is never delegated to an AI system at Level 4 Autonomous; Chapter 22).
Inputs. The claim as worded; the report or study behind it; the use's footprint record, if one exists (Chapter 6).
Steps.
- Boundary. Write the unit (vehicle kilometres, kilowatt-hours, visits, grams of CO2e), the system boundary and whether the footprint of the AI use is inside the figure.
- Baseline. Write what the benefit is measured against: the same asset before, a control group, a modelled counterfactual or the non-AI method. If none, the grade is asserted.
- Period and population. Write the period of observation and the number of assets, lines or people covered.
- Method and check. Write who measured or computed it, by which method, and whether anyone independent of the owner and of the supplier has checked it.
- Scale. Write whether the stated figure is observed or scaled from a smaller one by an assumption. If scaled, the grade is projected and the assumption is recorded.
- Grade and expiry. Take the lowest link. Record the grade, the date and the expiry. Under the series' convention a value claim expires after 180 days or when its conditions change, whichever comes first (AI Leader, Chapter 20, and AI Developer, Chapters 4 and 20) (35, Nordqvist, 2026) (36, Nordqvist, 2026).
Artefact. A grading record in version control beside the claim. The record below is illustrative and is the first draft of the evidence field of the benefit record BEN-* that Chapter 9 defines; it does not use that identifier, because the benefit records are numbered in Chapter 9.
# Claim grading record (illustrative; Nordvik Region, September 2032)
claim: "AI-assisted route optimisation reduces the emissions of regional public transport"
claim_text_source: "draft annual report 2032, section on digital services"
owner: Astrid Nyberg            # sustainability lead, climate and environment strategist
evidence_owner: regional public transport unit
grade: asserted
questions:
  boundary: not stated
  baseline: not stated
  period: not stated
  method: none shown
  independent_check: none
  footprint_of_ai_use_inside_figure: no
what_would_raise_the_grade:
  - state the unit (vehicle kilometres per passenger kilometre) and count both ends
  - pilot on two lines with two matched control lines for one timetable period
  - measure the footprint of the routing service and count it at the same boundary
  - repeat the measurement after one timetable change to test for rebound
evidence_date: 2032-09-20
expires: 2033-03-19             # 180 days for a value claim
publication: not approved       # reviewed by regional legal counsel before any report
Check. A reviewer who has not seen the claim can reconstruct its grade from the record.
Worked example: three claims graded (illustrative)
The three claims below are graded as they stand in September 2032, one grade each. The third is the target state of the route-optimisation claim after a controlled pilot, to show what the top grade requires. All figures and states are illustrative.
Table 3.2 grades the three claims.
Table 3.2: Three claims graded (illustrative).
| Claim (illustrative) | Grade today | Why | What would move it up |
|---|---|---|---|
| Hansa Mutual: claims-photo assessment reduces site visits | Asserted | Visits avoided are counted, not visits that would have happened; no distance, vehicle or fuel; service footprint not counted | Estimate visits from a matched period; apply measured distance and vehicle type; count the footprint; check the method |
| Nordvik Region: AI forecast of building energy use (backtest on a year of metered data) | Modelled | Forecast error is measured against meters, a result about the model; no operator has changed set-points on it | Use it in a few buildings for a heating season; compare with weather-normalised past seasons; record kWh |
| Nordvik Region: route optimisation after a pilot on two lines with two matched control lines (target state, not a result) | Measured in deployment (if run as specified) | Stated unit, control-line baseline, period, method and check by the Region's controller; four lines, one period | A second period and more lines; a rebound check on saved kilometres |
The third row is not a result but a design: the pilot as specified would earn the top grade for four lines in one period, and the Region could then claim exactly that and no more.
Across the modes and the organisations
Across the usage modes
Benefit differs by mode, and so does the way it can be demonstrated. Table 3.3 gives the typical benefit, whether it can be measured and the delegation note for each mode.
Table 3.3: Benefit, measurability and delegation across the usage modes.
| Mode | Typical benefit | Can it be measured? | Footprint and delegation note |
|---|---|---|---|
| Mode 0 Ambient AI | Features inside licensed software | Rarely: the organisation cannot meter the feature or isolate its effect | Supplier-reported row in the register; no claim without the supplier's method |
| Mode 1 and Mode 2 | Drafting, search and assistance by a person | Seldom as an environmental effect; productivity effects are contested (AI Developer, Chapter 20) | A time saving is not a resource saving until the time displaces something physical |
| Mode 3 Agentic work tool | Multi-step tasks for a person | Possibly, per task, with a baseline from the manual route | A task that starts further work has a footprint of its own (Chapter 15) |
| Mode 4 Built AI applications | Forecasting, routing, classification and control inside a process | Yes, where the process has a meter and a baseline | The best-evidenced class in this chapter; a built system can be benchmarked against its non-AI predecessor |
| Mode 5 Autonomous production agents | Control of a process without a person in each step | Yes, but the agent's budget and stop path are part of the benefit case | Never Level 4 Autonomous for compute beyond a budget set by someone else, disabling measurement, budget or stop path, or publishing an environmental claim |
The cooling-control case of the chapter is a Mode 5-like pattern with a human stop path. The delegation lesson is the same in every mode (Level 4 prohibitions as in Chapter 4): an AI system may help to draft a benefit case, but a named owner grades it, and a system never grades its own claim.
Nordvik Region and Hansa Mutual
The environmental profiles are in docs/EXAMPLE_ORGANISATIONS.md; the figures and states below are illustrative.
Nordvik Region. Astrid Nyberg, the sustainability lead, grades claims; Henrik Dahl owns the register of the AI estate; Pär Lindgren, finance director, owns the benefit claims that rest on cost; Mats Öberg, the property and energy manager, supplies the meter data for buildings; Maria Åkesson reviews a claim before it is published. Two candidate benefits are proposed for the year: an AI-assisted route optimisation for regional public transport and an energy-use forecast for the Region's buildings. Neither has a baseline at September 2032, and the profile records that no benefit record exists for any use and that the only measured effect of an AI use is the telephone-service count for service-point-check (41 calls in August 2031, 17 in January 2032, one month, not controlled). That count is a service effect, not an environmental one, and has no control. Its first decision of the Region on this chapter's method is to grade the route-optimisation sentence as asserted and to withhold it from the annual report until the pilot of the worked example has produced a result; Chapter 9 applies the method to the pilot.
Hansa Mutual. Dr. Verena Lindner, head of group sustainability and CSRD reporting, owns the method for counting AI inside Scope 2 and Scope 3 and signs the claim records; Dr. Annette Krämer, chief risk officer, chairs the group AI governance board that approves every environmental claim before publication; Ulf Zimmermann reviews it. Two candidate benefits appear in the group's sustainability report without a boundary: the claims-photo assessment that reduces site visits, and a catastrophe-risk model used in climate adaptation pricing. The first is graded asserted in the worked example. The second is a benefit of a different kind: any environmental effect of a climate-risk pricing model passes through decisions that people make. It is graded asserted as an environmental benefit, and its other benefits are recorded separately in Chapter 9.
Observable, expected, speculation
Observable. Deployed AI for forecasting and control in energy, buildings and data-centre cooling reports savings in the sources read here, mostly vendor-reported or operator-reported and with baselines that differ. The systematic critique of eight prominent sources found that most coded claims rested on weak or no evidence (63, Joshi, 2026). Per-use efficiency improves quickly while total data-centre demand grows (38, IEA, 2026).
Expected. More applications will be measured, and more benefit claims will carry a stated baseline, as the rules on environmental claims and reporting mature (Chapter 22). This is expected because of the instruments Chapter 22 reads and because the practice is cheap for an organisation that already meters its own assets. The label follows the series' convention of AI Governance, Chapter 22 (26, Nordqvist, 2026).
Speculation. The size of AI's net contribution to climate goals by 2035 is speculation. The potential estimates read here disagree in kind (Stern: a reduction in three sectors; Alpine: a net increase in a model that adds the fossil-supply side), they omit or isolate rebound, and none is a measurement. This chapter takes no side on that number. The author's own projections are confined to Chapters 25 and 29.
Conclusions
These are the book's own conclusions from the evidence above, not findings of the sources.
- The benefit side is real and uneven. Measured, vendor-reported results exist for narrow control problems such as data-centre cooling, reported ranges for buildings, operator estimates for forecasting with a mixed independent result on skill, and potentials for sectors with the sign of the net effect disputed.
- Most of the evidence concerns traditional AI, and a benefit shown for one kind says little about the other.
- A claim's grade is its weakest link, and a baseline is part of the grade. The commonest error is to take a potential for an outcome.
- The benefit within reach is the benefit an organisation can meter, baseline and own. For the rest, its task is to say that the benefit is not shown.
- Benefit is a separate ledger. An unproven benefit does not offset a measured footprint, and a purchased offset does not replace reduction. Of the three tests of the net-benefit principle (Chapter 4), this chapter supplied only the evidence grade for Compare; it did not perform the comparison.
Summary
This chapter graded the benefit side with the discipline that Chapter 2 applied to the footprint. It concerns E2 Justify. It set four evidence grades (asserted, projected, modelled, measured in deployment) and three rules for using them (the grade is the lowest link, a baseline is part of the grade, independence is recorded beside the grade), and applied them to the cases that could be read: weather forecasting, data-centre cooling, buildings, and power, food and transport. It assigned no grade to grids, industry, logistics, agriculture, monitoring and materials, because no measured-deployment study was read for them.
It read the models in two directions. Stern et al. project 3.2 to 5.4 GtCO2e a year in three sectors by 2035 and exclude rebound, while Alpine et al. find that AI productivity gains in fossil supply raise net CO2 by 0.47 to 1.8 gigatonnes a year. It read the critique by Joshi, in which 26 per cent of 154 claims cited published academic papers and 36 per cent cited no evidence. None of these measures the net effect of deployed AI.
For an enterprise or authority the lesson is practical: claim only the benefit it can meter, baseline and own, grade each claim with the practical guide before it is published, record the grade with an expiry, and keep the benefit in its own ledger. Benefit is a separate ledger that Chapter 9 compares with the footprint of a use; neither side pays for the other. Chapter 4 now defines the method that holds the two sides together: the five environmental functions, the optimisation hierarchy and the net-benefit principle with its three tests, Count, Compare and Cap.
Sources
- Nordqvist, G. (2026). AI Governance: Governing Artificial Intelligence in European Enterprises and Public Authorities. The Transformed Architecture, Book 2, published at aig.geon.se. Chapters 16A and 22. (26, Nordqvist, 2026)
- Nordqvist, G. (2026). AI Developer: How the Developer Role Changes When AI Is Used Broadly in European Enterprises and Public Authorities. The Transformed Architecture, Book 12, published at developer.geon.se. Chapters 4 and 20. (36, Nordqvist, 2026)
- Stern, N., Romani, M., Pierfederici, R., Braun, M., Barraclough, D., Lingeswaran, S., Weirich-Benet, E. and Niemann, N. (2025). Green and intelligent: the role of AI in the climate transition. npj Climate Action 4, 56, published 23 June 2025. https://doi.org/10.1038/s44168-025-00252-3 (retrieved November 2026). (61, Stern et al., 2025)
- Alpine, W., Geldner, N., Alpine, H. and Chepeliev, M. G. (2026). AI-driven productivity gains enable more CO2 emissions than they avoid in a global energy-economy model. npj Climate Action 5, 71, published 4 August 2026. https://doi.org/10.1038/s44168-026-00411-0 (retrieved November 2026). (62, Alpine et al., 2026)
- Joshi, K. (2026). The AI Climate Hoax. Beyond Fossil Fuels with Friends of the Earth US, Stand.earth, Green Screen Coalition, Green Web Foundation and Climate Action Against Disinformation, February 2026. https://beyondfossilfuels.org/wp-content/uploads/2026/02/AI-for-climate-claims-Report_FEB-2026_FINAL-2-16.pdf (retrieved November 2026). (63, Joshi, 2026)
- European Centre for Medium-Range Weather Forecasts (2025). ECMWF's ensemble AI forecasts become operational. News release, 1 July 2025. https://www.ecmwf.int/en/about/media-centre/news/2025/ecmwfs-ensemble-ai-forecasts-become-operational (retrieved November 2026). (64, European Centre for Medium-Range Weather Forecasts, 2025)
- Kocsis, M. and Baran, S. (2026). AI and physics-based weather forecasting: A comparative study. arXiv:2606.02508, 1 June 2026, preprint. https://arxiv.org/abs/2606.02508 (retrieved November 2026). (65, Kocsis & Baran, 2026)
- International Energy Agency (2026). Key Questions on Energy and AI. World Energy Outlook Special Report, April 2026. https://www.iea.org/reports/key-questions-on-energy-and-ai (retrieved November 2026). (38, IEA, 2026)
- Gasparik, A., Gamble, C. and Gao, J. (2018). Safety-first AI for autonomous data center cooling and industrial control. Google, 17 August 2018. https://blog.google/inside-google/infrastructure/safety-first-ai-autonomous-data-center-cooling-and-industrial-control/ (retrieved November 2026). (66, Gasparik et al., 2018)
- Srivastava, R. (2025). The Use of Artificial Intelligence in Building Energy Management Control Systems. American Council for an Energy-Efficient Economy (ACEEE) topic brief, November 2025. https://www.aceee.org/wp-content/uploads/2026/05/o-z/the_use_of_artificial_intelligence_in_building_energy_management_control_systems.pdf (retrieved November 2026). (67, Srivastava, 2025)
- Rolnick, D., Donti, P. L., Kaack, L. H. et al. (2019). Tackling Climate Change with Machine Learning. arXiv:1906.05433, first submitted 10 June 2019. https://arxiv.org/abs/1906.05433 (retrieved November 2026). (68, Rolnick et al., 2019)
- Nordqvist, G. (2026). AI Leader: How Leadership Roles Change When AI Is Used Broadly in European Enterprises and Public Authorities. The Transformed Architecture, Book 11, published at leader.geon.se. Chapter 20. (35, Nordqvist, 2026)