Where and When: Grid Carbon Intensity, Water Stress and Carbon-Aware Scheduling
The fourth level of the optimisation hierarchy asks where and when a piece of AI work should run, once the earlier levels have asked whether it should run at all, with which model and how efficiently. The hierarchy is a ranking of levers, not a sequence of chapters: Part IV treated the levers that design the solution, including hardware at level five (Chapter 16), and this chapter, which opens Part V, treats place and time at level four as an operating decision. It concerns E4 Operate: placing and timing work on the grid and in the basin where it runs, under a budget and with a stop path. It serves the Count test, because placement changes the carbon rate that the count is multiplied by, and the Cap test, because the scheduler runs under a budget that a person sets and a stop path that it does not control. It ends in a placement policy PLC that a scheduler can read and a person can approve.
The chapter builds on AI Platform and Security, Chapter 13 (27, Nordqvist, 2026), whose conclusion is that sovereignty is a set of verifiable properties, among them knowing where a workload runs and which law governs it, and not a postcode; on AI Operations, Chapter 11 (34, Nordqvist, 2026); and on AI Governance, Chapter 6 (26, Nordqvist, 2026). A placement policy that ignores sovereignty will move work to a cleaner grid and into a legal problem. Chapter 18 treats the data centre, and Chapter 22 what an organisation may claim about the electricity it buys.
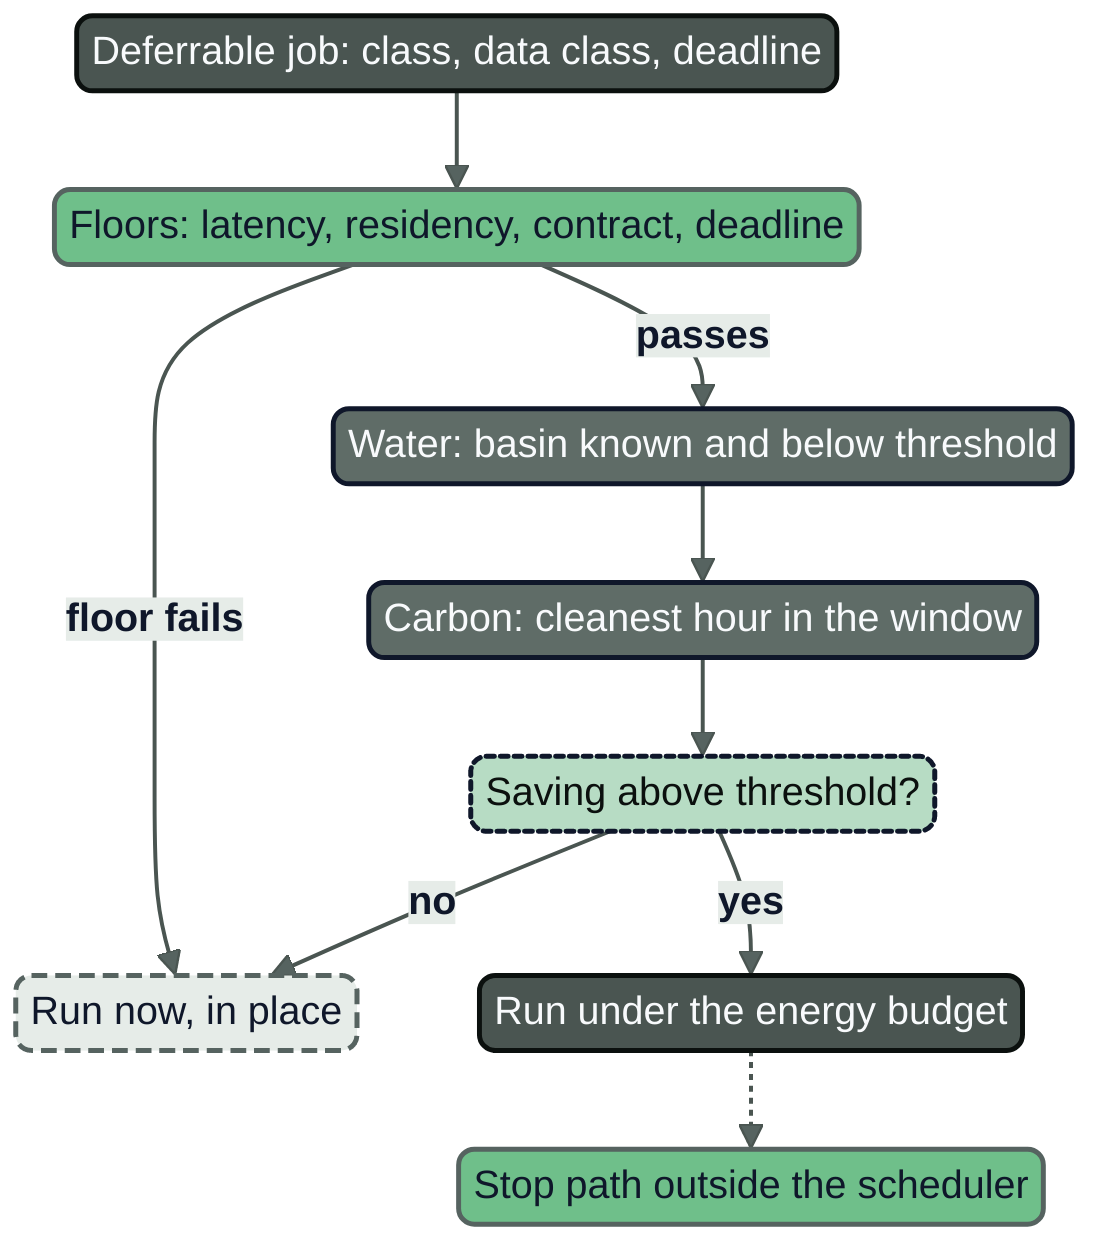
Figure 17.1: The placement decision for a deferrable job. Floors (latency, residency, contract, deadline) are tested before any intensity figure is read. The scheduler cannot edit the floors, the budget or the stop path.
The same job on three grids
Take one job that uses 1,000 kWh of electricity at the facility boundary, an evaluation run or a re-scoring batch. Run it on the Swedish grid in 2025 and, with the annual mean of the flow-traced series of one data provider, it is associated with about 21 kg CO2e. Run the same job in Germany and the figure is about 335 kg. Run it in Poland and it is about 677 kg. The ratios are 15.7 and 31.8 to one, computed from three annual means that share one method and one year (41, Electricity Maps, 2026). Nothing about the model, the hardware or the code changed; the job moved, and the carbon rate moved with it.
That is the case for caring about place, and the reason for caution: a multiplier of sixteen is large enough that a careless figure can make a bad decision look good. The comparison holds only because the three means share a method, a year and a data provider.
What a grid carbon-intensity figure is
Carbon intensity is the mass of greenhouse gases emitted, in grams of CO2 equivalent, per kilowatt-hour of electricity. Five choices decide what a published figure means, and a figure that does not state them is not yet usable.
Whose emissions are counted. A production-based figure divides the emissions of the plants inside a country or zone by what they generate. A consumption-based figure, which the data provider calls flow-traced, follows imports and exports across borders, so that a country that imports from a dirtier neighbour carries part of that neighbour's intensity.
Which emissions are counted. A direct figure counts what is emitted at the plant, mainly from burning fuel. A lifecycle figure adds the emissions of building the plant and supplying the fuel, so wind, solar, nuclear and hydro stop being zero. The European Environment Agency's indicator is direct and applies a zero factor to nuclear and renewables, excludes the emissions of the biomass it burns and excludes upstream emissions such as methane leaks and construction (155, European Environment Agency, 2026). The country pages of Electricity Maps, the data provider whose annual means this chapter uses, do not say whether their annual means rest on lifecycle or direct factors, and this book therefore calls them flow-traced figures and nothing more (41, Electricity Maps, 2026).
Average or marginal. An average figure is the mean intensity of everything the grid generated in the period. A marginal figure is the intensity of the plant that would change its output if demand changed by a little, usually higher where fossil plants set the price, and it is the one that matters for adding or moving load. The annual means in this chapter are averages; none of the sources read reports a marginal series for the countries named, and the chapter supplies none.
What period. An annual mean hides the hour and the season. The same grid has a morning and an evening, a windy week and a calm one, a summer noon with solar and a winter evening without it.
Whose measurement. A grid operator, a statistics body and a commercial data provider each publish figures built on their own assumptions. The European Environment Agency page of 9 November 2026 reports that the EU's intensity in 2025 was about 3 per cent below 2024 and about 64 per cent below 1990, and names Cyprus, Poland, Estonia and Malta as the highest and Sweden, Finland and Luxembourg as the lowest, with no gram figure that could be read (155, European Environment Agency, 2026). The EuroSys study used below took about 16 g CO2eq/kWh for Sweden from hourly data of 2020 to 2022 (116, Sukprasert et al., 2024); Table 17.1 gives 19.0 g production-based for 2025. The spread is a spread of method and year, and the book never lines such numbers up in one comparison.
Table 17.1: Carbon intensity of electricity in g CO2eq/kWh, annual mean and hourly extremes of 2025. Source: Electricity Maps, Electricity Grid Review 2025, country pages, retrieved November 2026 (41, Electricity Maps, 2026). Independent of the grid operators, a commercial data provider; boundary: national zone, flow-traced and production-based as stated; the pages do not state lifecycle or direct. The "Reading" column is the book's, not the source's. The European Environment Agency's direct, production-based indicator is a different boundary and is not in the table.
| Country | Flow-traced mean | Production-based mean | Hourly range, flow-traced | Reading |
|---|---|---|---|---|
| Sweden | 21.3 | 19.0 | 11.6 to 57.6 | Clean and flat |
| Finland | 66.4 | 72.8 | 35.1 to 175.3 | Clean, wider swings |
| France | 32.0 | 29.6 | 13.6 to 87.4 | Clean, nuclear base |
| Ireland | 301.2 | 321.1 | 104.5 to 574.0 | Gas and wind, wide swings |
| Germany | 335.4 | 362.5 | 97.0 to 632.7 | Wide swings |
| Poland | 676.6 | 713.4 | 318.2 to 941.4 | Persistently high |
The spread between countries is larger than any effect of timing within one country. The hourly range is wide: a job that waits a few hours in Germany can change its carbon rate several times over; in Sweden it changes it by tens of grams on a base that is already low.
Hours and seasons
The daily pattern of a grid follows its generation mix. Where solar is large, the middle of a summer day is clean and the evening is not. The data provider's seasonal profiles for Germany in 2025 give, for June to August, a flow-traced trough of 155 g at 11:00 and a peak of 376 g at 20:00, a spread of 221 g, and for December to February a trough of 349 g at 11:00 and a peak of 408 g at 15:00, a spread of 60 g (41, Electricity Maps, 2026). Poland shows the same logic at a higher level: a summer spread of 287 g and a winter spread of 96 g.
The book's reading, not a finding of the source: the value of waiting is seasonal, large in June and small in January; it is regional, largest where solar or wind is large and gas stands behind it; and it is available only to work with slack.
Observable: the hourly and seasonal ranges in Table 17.1 and above are documented for 2025. Expected: better hourly series, since at least one large provider will begin applying marketplace granular certificates to its hourly figures from 2026 (43, Google, 2026). Speculation: an hourly marginal series with a published method for every European zone within a few years.
What can move, and what cannot
Whether a job can shift in time or in space is a property of the job, and the first column of a placement policy is the class of the work. Table 17.2 sets out the classes that the two organisations run.
Table 17.2: Classes of AI work and what decides whether they can move. The classes are the book's; the examples are from the profile of the two organisations and are illustrative.
| Class of work | Shift in time | Shift in space | Floor that decides | Example |
|---|---|---|---|---|
| Interactive inference | No | No | Latency, user experience, residency | Citizen-service assistant answering a resident; claims assistant used by a handler |
| Agent run inside a service level | Rarely | Rarely | Time to first action, data class | Claims-triage agent acting on registration |
| Batch inference and indexing | Yes, within the deadline | Yes, within residency | Deadline, data class, contract | Nightly indexing of the retrieval corpus; re-scoring of a portfolio |
| Evaluation runs | Yes | Yes, within residency | Deadline for the release gate, data class | Weekly evaluation of a classifier |
| Fine-tuning and retraining | Yes, with a window | Yes, within residency and licences | Data class, residency, licence | Quarterly retraining of the benefits-triage ranking; fine-tuning of an open-weight classifier |
Interactive use is most of an assistant's volume and cannot wait. It can still be placed once, at design time: the choice of region for a service that will run for years is made by the architecture and the contract, not by a scheduler every night. Batch classes can be placed on every run, and they are the subject of the policy below. Pre-training of a foundation model is not a class either organisation runs.
Shifting in time
Carbon-aware scheduling in time means delaying a flexible job to a later hour at which the forecast carbon intensity is lower, within a deadline. Google's Carbon-Intelligent Compute Management system forecasts grid intensity and its own demand each day and sets hourly limits, which the authors call virtual capacity curves, on the capacity available to flexible workloads, lower in carbon-intensive hours, with the daily total unchanged so that the work still completes within the day (117, Radovanovic et al., 2021).
The numbers come from replay studies. Sukprasert and colleagues, at EuroSys 2024, used hourly carbon-intensity data for 123 regions for 2020 to 2022 and asked what the best possible shifting would save under stated slack (116, Sukprasert et al., 2024). Their finding for time is modest. With 24 hours of slack the reduction is about 31 g CO2eq/kWh, 8.4 per cent of the dataset's global average (Section 5.2.6 of the paper). With a full year of slack, which no operational job has, it is about 127 g, 34 per cent, in that section and 135 g, 37 per cent, in an earlier one; the paper gives both. The figure of 189 g, 51 per cent, that sometimes appears is the bound for one region, Oceania, with one year of slack, and would overstate the 24-hour saving about sixfold.
These are upper bounds from a replay with perfect knowledge, no capacity limits and no cost of waiting. The honest reading is that temporal shifting saves a single-digit to low double-digit share of the carbon of the shifted work with a day of slack, and less on a cleaner grid; the abstract states that the advantage of carbon-aware over carbon-agnostic scheduling shrinks as the energy supply becomes greener (116, Sukprasert et al., 2024).
Observable: replay studies find real, bounded savings from temporal shifting, smaller on clean grids. Expected: operational savings below the replay bounds. Speculation: forecasts cheap enough to close much of the gap.
Shifting in space
Spatial shifting means running a flexible job in a different region. The same study finds that place matters more than time. Moving a workload to the greenest region of the dataset, Sweden at about 16 g CO2eq/kWh on 2020 to 2022 data, reduces carbon by 352 g on average, 96 per cent of the global average, if capacity there is unlimited, and one migration captures most of the benefit (116, Sukprasert et al., 2024). The infinite-capacity assumption is the weak point, as the Nordic case shows. The book's reading is that where a job may move in space, the design-time placement is worth more than the run-time scheduling decision.
Space is also where the legal floors sit. A move to another region is a transfer of the data the job reads and writes. For personal data, Article 44 of the General Data Protection Regulation sets the general principle that a transfer to a third country takes place only if the conditions of its Chapter V are met (3, European Union, 2016). A move inside the Union and the European Economic Area is not such a transfer, but it can breach a contract, a national rule on where public-sector data is processed, or the sovereignty properties promised to the board. The Region's contract fixes EEA-only processing with customer-held keys; at Hansa Mutual the underwriting-support model, which handles special-category data, stays on the Frankfurt platform. Chapter 19 treats the choice of hosting; here the policy lists the regions a class of data may use, and the scheduler chooses only among them.
Water stress as the competing criterion
The cleanest grid is not always the one with the most water. Water stress is measured per river basin and season, and a placement that ignores it can reduce carbon and worsen a local shortage. The European Environment Agency reads the water exploitation index plus (WEI+), the share of renewable freshwater abstracted, as stress above 20 per cent and severe stress above 40 per cent, notes that no formally agreed European threshold exists, reports that water scarcity affected 28 per cent of EU land area and 32 per cent of the EU population in at least one season of 2023, and finds that scarcity intensifies from April to September (114, European Environment Agency, 2025). It names Cyprus and Malta as the most severely affected and Greece, Romania, Portugal, Italy and Spain mainly in spring and summer. It does not name Sweden, Finland or Ireland, which is not a measurement for any site there.
Chapter 7 explained why a data-centre water figure is not a basin figure. For placement the rule of method is: a policy that includes water holds, per region, the WEI+ of the basin for the months in which the work runs, and a threshold above which deferrable work is not moved into that region. The book's hypothesis, for each site to test, is that the cleanest grids in Table 17.1 are mostly not in water-stressed regions, and that a low-carbon grid with a stressed basin is more likely in a solar-rich southern region. No source read compares data-centre sites on both criteria. The policy therefore writes the water figure of each region as a field, treats an empty field as stressed for any move into that region, and leaves the home region alone.
The Nordic case
The Nordic grids give the cleanest and flattest figures in Table 17.1: 21.3 g in Sweden, 66.4 g in Finland, with hourly extremes in Sweden of 11.6 and 57.6 g. Two things follow, and the second is less often said.
The first is that timing buys little there: a job that waits in Sweden moves between values that are all low, so for an organisation hosted in the Nordic region the placement is already the main saving. This is the pattern the replay study predicts for a clean grid.
The second is that a clean average does not make additional load free, and that the scarce resource in the north is increasingly the connection and not the clean kilowatt-hour. Svenska kraftnät, the Swedish transmission system operator, reports data-centre applications of 8,200 MW of applied-for electricity use in its connection queue on 1 November 2026: 6,000 MW in electricity area SE3, 1,650 MW in SE2, 500 MW in SE1 and none in SE4, counted until capacity has been reserved and a preliminary notice sent, offshore wind excluded; the total is rounded to 50 MW and the four area figures sum to 8,150 MW (39, Svenska kraftnät, 2026). An application is not a built data centre, and the page does not say how many will proceed. The sources read cannot answer the marginal intensity of a new load in SE3, or whether extra load raises imports in the hours it is added. The Region can answer whether its supplier discloses the zone and the hourly meter data of its hall.
Observable: the connection queue for data centres in Sweden was 8,200 MW on 1 November 2026, and the Swedish and Finnish annual means in Table 17.1 are among the lowest in Europe. Expected: continued pressure on connection capacity in the north for as long as applications are made at this scale; the evidence is the queue itself and not a forecast by the operator. Speculation: that additional AI load in the north raises the carbon rate of the hours at which it runs.
Svenska kraftnät has not decided to restrict connections: Chapter 18 reports that on 3 November 2026 it announced that it is considering temporary restrictions in handling individual large applications.
What shifting saves
Beyond the replay studies, the search behind this chapter found no peer-reviewed measurement of carbon-aware scheduling savings in a production system. Reported savings of 18.7 to 42 per cent in 2026 preprints came from simulations or assumed energy models and were seen only as search summaries, so none is used. What an organisation can do is replay its own jobs against its own hourly data before the policy is switched on.
Moving a job off hardware that stays powered does not switch the hardware off. At Hansa Mutual the 96 accelerators of the Frankfurt platform run at an average utilisation of 0.52 (illustrative, September 2032), so a job moved to a cloud region adds its energy there and removes only the marginal energy it used on the platform. The footprint of a move is the added energy in the destination minus the avoided marginal energy at the origin, and a policy that counts only the destination's cleaner rate can report a saving that the group's total does not show.
Market-based claims and the physical grid
A purchase of renewable electricity does not change the hourly intensity of the grid at the hour a job runs. The group buys electricity with guarantees of origin on an annual basis, so its market-based figure and its location-based figure differ (profile: 350 g CO2e per kWh location-based in Frankfurt, illustrative). A placement decision reads the physical, location-based, hourly signal. The market-based figure answers what the organisation may report and claim, and Chapter 22 treats it. A policy that mixes them can move work towards a region with a good tariff and a poor hour.
The Commission's report under Article 12 of Directive (EU) 2023/1791 states that over 70 per cent of reported sites match 100 per cent of their electricity with renewable energy on an annual basis, that much of this comes from power purchase agreements and guarantees of origin "not necessarily connected to local production or new additions of renewable production", and that attention should go to origin, technology, additionality and temporal matching (11, European Commission, 2026).
One large provider publishes hourly matching by grid region. Google's 2026 Environmental Report states that about 65 per cent of its electricity consumption was matched hourly with carbon-free energy (CFE) globally in 2025, 66 per cent in 2024, and reports it by region with the grid's own carbon-free share, which it calculates with hourly grid data from Electricity Maps (43, Google, 2026). Table 17.3 gives the European rows.
Table 17.3: Percentage of one provider's electricity consumption matched hourly with carbon-free energy, 2025, by grid region, with the contracted part and the grid's own carbon-free share. Source: Google, 2026 Environmental Report, regional table (43, Google, 2026). Vendor-reported, not independently audited; marketplace granular certificates were not applied in 2025, and the provider estimates that with them the global figure would have been 69 per cent. Retrieved November 2026.
| Grid region | Provider's hourly CFE | Of which contracted | Carbon-free share of the grid | Boundary |
|---|---|---|---|---|
| Finland (Fingrid) | 98 | 75 | 95 | Provider load in the region |
| Denmark (Energinet) | 92 | 35 | 89 | Provider load in the region |
| Netherlands (TenneT) | 82 | 68 | 55 | Provider load in the region |
| Germany | 70 | 19 | 64 | Provider load in the region |
| Ireland (EirGrid) | 60 | 18 | 50 | Provider load in the region |
A provider's hourly matched share can be far above the grid's own, 82 against 55 per cent in the Netherlands, because the provider has contracted clean supply there. It is not the intensity that a customer's job sees, because a customer buys a service and is not the provider's load. The report also notes a lag of often four to five years between signing a power purchase agreement and delivery, and says that its share could fall while procurement continues (43, Google, 2026). A buyer who uses such figures in a placement decision treats them as vendor-reported and asks for the method; the supplier disclosure record of Chapter 23 has the field.
A placement policy in one page
A placement policy PLC states, for each class of work, which regions it may use, in which window, on which signal, behind which floors, under which budget and with which stop path. It is a record in version control, approved by a person, and read by the scheduler. Five rules shape it.
First, floors come before intensity. Interactive use, a data class that a region is not listed for, a deadline closer than the run time plus the wait, and a region without a footprint record or a supplier disclosure each end the decision, whatever the grid says.
Second, a saving threshold keeps trivial moves out, because a move has costs the saving does not show: idle capacity, a missed window, a bill, an operator's attention.
Third, water is a condition for moving into a region, with an empty field counting as stressed.
Fourth, the signal is named, dated and limited: the source, its method, a maximum age, and a statement that it is not used for claims.
Fifth, the scheduler holds a mandate, not a free hand. At Level 3 Bounded it may choose a start and a region inside the policy. It may not edit the policy, add a region, move special-category data, raise the budget or disable the meter. Level 4 Autonomous is never used for an agent that provisions or scales its own compute, or starts work, beyond a budget set by someone else, or for an action that disables the measurement, the budget or the stop path (Chapter 15 gives the mandate manifest MND-*).
The budget is an energy budget for the class, set by a person who is not the scheduler and measured outside it, at the meter of the data centre and not from the scheduler's own log. The stop path is an action that someone other than the scheduler can take and that does not go through it: set the queue admission quota to zero in the cluster, and revoke the scheduler's job credential at the identity provider. A stop path that depends on the scheduler being healthy fails when it is needed. The record states the holder, the path, the date of the last drill and its validity, 90 days in this book's convention (Chapter 4).
Nordvik Region: PLC-NR-0001
The Region runs its AI estate on reserved accelerators of a hosting provider in a Nordic data centre, in nordvik-dc, and through a hosted model it cannot place. Its contract NR-2026-031 fixes EEA-only processing and customer-held keys, public procurement law binds a change of supplier, and sovereignty is part of its mandate. Space is therefore closed, in one line. Time is open for two classes, and switched off until a replay shows it is worth switching on.
id: PLC-NR-0001
status: proposed                  # active once the stop path has a recorded drill
owner: maja-lindqvist             # platform lead
reviewed_by: [astrid-nyberg, mats-oberg]
approved_by: henrik-dahl
review_by: "2033-09-30"
applies_to: [nightly_indexing, retraining_quarterly]
signal:
  basis: location-based, hourly, average
  source: hourly-grid-intensity-service
  zone_of_site: { nordvik-dc: SE3, hosting-provider-site: null }   # SE3 illustrative; null until disclosed
space_shift: false                # floor: contract NR-2026-031 (EEA only, customer-held keys), public procurement, sovereignty
regions: [nordvik-dc, hosting-provider-site]    # each use stays where its record says
classes:
  nightly_indexing:
    window: { earliest_start: "22:00", latest_start: "04:00" }
    deadline: "06:30"
    runtime_h: 2
  retraining_quarterly:
    window: { earliest_start: "Fri 18:00", latest_start: "Sun 06:00" }
    deadline: "Mon 06:00"
    runtime_h: 40
time_shift:
  enabled: false                  # on only after a replay record shows a saving above min_saving
  min_saving: { relative: 0.10, kg_co2e: 1.0 }
  replay_record: null
budget:
  record: EBG-NR-0003
  energy_kwh_per_month: 3000      # indexing only, facility boundary, illustrative; retraining is unmetered
  measured_by: facility meter of nordvik-dc (Mats Öberg), not the scheduler
stop:
  holder: [mats-oberg, platform-on-call]
  path: batch queue suspended in cluster admission control; scheduler job credential revoked at the identity provider
  independent_of_scheduler: true
  last_drill: null
  drill_valid_days: 90
scheduler_may_not: [edit_policy, add_region, change_zone, raise_budget, disable_meter]
PLC-NR-0001, illustrative, proposed. The bidding zone of the hosting provider's site is null because the disclosure record SDR-NR-0001 does not give the grid mix of the hall (Chapter 8); the tender annex TA-NR-ENV-01 will ask for it (Chapter 23).
Hansa Mutual: PLC-HM-0001
The group has three places to run batch work: its Frankfurt data centre, Cloud A in Ireland, which holds the platform's burst capacity, and Cloud B in France, which holds analytics and the recovery of the claims core. Both cloud regions are placeholders in the profile. The profile's grids differ widely, and the group's policy is the more active of the two, but it too starts with the floors and with an unknown water figure that blocks spatial moves until the basin has been looked up.
id: PLC-HM-0001
status: proposed                  # active once the stop path has a recorded drill
owner: anja-weiss                 # head of the group AI platform
reviewed_by: [katja-neumann, jan-berger, verena-lindner]
approved_by: annette-kraemer      # group AI governance board, budgets above the threshold
review_by: "2033-09-30"
applies_to: [evaluation_weekly, fine_tuning, batch_rescoring]
signal:
  basis: location-based, hourly, average   # a marginal series is not available
  source: hourly-grid-intensity-service    # named in the supplier record
  max_age_hours: 3
  not_used_for: [environmental_claims]     # claims use Chapter 22 methods
regions:                                   # figures: EEA WEI+ for April to September
  hansa-dc-frankfurt: { zone: DE, data_classes: [standard, special_category], wei_plus_apr_sep_pct: null }
  cloud-a-ireland:    { zone: IE, data_classes: [standard], wei_plus_apr_sep_pct: null }
  cloud-b-france:     { zone: FR, data_classes: [standard], wei_plus_apr_sep_pct: null }
water:
  exclude_above_pct: 20
  unknown_counts_as_stressed: true         # for moves into a region; the home region stays
classes:
  evaluation_weekly:
    starts: ["Mon 09:00", "Mon 20:00", "Tue 11:00", "Wed 11:00"]   # latest start leaves the run time
    deadline: "Thu 12:00"
    runtime_h: 6
min_saving: { relative: 0.10, kg_co2e: 50 }
floors:                                    # when not to shift
  - interactive or latency-bound use
  - special-category data, underwriting model, or any region not listed for the data class
  - deadline closer than the run time plus the wait
  - saving below min_saving
  - a region with no footprint record or supplier disclosure
budget:
  record: EBG-HM-0004
  energy_kwh_per_month: 9500               # facility boundary, illustrative
  measured_by: facility meter, Frankfurt data centre (Katja Neumann), not the scheduler
stop:
  holder: [jan-berger, platform-on-call]
  path: queue admission quota set to zero in the cluster; credential of the scheduler revoked
  independent_of_scheduler: true
  last_drill: null
  drill_valid_days: 90
scheduler_may: [choose_start, choose_region_within_policy]
scheduler_may_not: [edit_policy, add_region, move_special_category_data, raise_budget, disable_meter]
PLC-HM-0001, illustrative, proposed. The Polish service centre processes claims but the profile's compute is in Frankfurt and the two clouds, so the policy does not list a Polish region.
The rule for when not to shift is the floors list and the threshold under it, and the decision logic is short enough to read in full. The function below reads the policy, applies the floors and the water rule, picks the lowest-intensity start among the eligible regions and starts, and returns to the home region when the saving is under the threshold. It was run against the policy above.
import yaml

def place(job, policy, forecast):
    """forecast: {(region, start): g CO2e per kWh}. Returns (region, start, reason)."""
    cls = policy["classes"].get(job["class"])
    home = job["home"]
    if job["interactive"] or cls is None:
        return home, None, "floor: interactive or class not listed"
    eligible = []
    for region, spec in policy["regions"].items():
        if job["data_class"] not in spec["data_classes"]:
            continue
        if region != home:
            wei = spec["wei_plus_apr_sep_pct"]
            if wei is None and policy["water"]["unknown_counts_as_stressed"]:
                continue
            if wei is not None and wei > policy["water"]["exclude_above_pct"]:
                continue
        eligible.append(region)
    base = forecast[(home, job["default_start"])]
    g, region, start = min((forecast[(r, s)], r, s)
                           for r in eligible for s in cls["starts"] if (r, s) in forecast)
    kg = job["energy_kwh"] * (base - g) / 1000
    if kg < policy["min_saving"]["kg_co2e"] or (base - g) / base < policy["min_saving"]["relative"]:
        return home, job["default_start"], "floor: saving below threshold"
    return region, start, f"saves {kg:.0f} kg CO2e"
Fed the German summer profile quoted above (376 g on Monday at 20:00 and 155 g on Tuesday at 11:00 in Frankfurt) and a 1,800 kWh run, it returns Frankfurt on Tuesday at 11:00 and a saving of 398 kg. Fed a job with special-category data, it never considers another region. Fed a winter pair of 408 and 400 g it returns the home start, because the saving is under the threshold. The scheduler cannot change any of that, because the policy it reads is edited only by a pull request that the approver signs.
Worked examples
Nordvik Region: a nightly indexing job (illustrative)
The Region's retrieval index for the staff and citizen assistants is rebuilt each night in nordvik-dc. The job uses 58 kWh of IT energy and, at the data centre's power usage effectiveness of 1.55 (illustrative), about 90 kWh at the facility boundary. At the profile's location-based factor of 32 g CO2e per kWh the job emits about 2.9 kg a night and about 1.05 t a year. At the 2025 flow-traced annual mean of 21.3 g from Table 17.1 it emits about 1.9 kg a night and about 0.70 t a year.
The two annual figures differ by about 0.35 t, and the difference is the choice of factor. The hourly extremes of Table 17.1, 11.6 and 57.6 g, bound the saving from waiting but do not estimate it: an eight-hour night window offers the best of eight values and not of 8,760. The Region has no hourly series for its zone and no replay, so the policy keeps time_shift.enabled: false. The next action is a one-month replay of the job's real start times against its zone's hourly series; if it shows a saving above 10 per cent and 1 kg per night, a pull request switches the policy on.
Hansa Mutual: the weekly evaluation run (illustrative)
The group runs a weekly evaluation of the claims-routing classifier and the claims-triage agent on the Frankfurt platform: 1,800 kWh at the facility boundary, six hours, results needed by Thursday 12:00 for the release gate. Table 17.4 sets the options against the real annual means of Table 17.1 and the real daily profiles of Germany.
Table 17.4: One illustrative weekly run of 1,800 kWh at facility boundary, operational and location-based only, with real 2025 flow-traced carbon rates of the data provider (41, Electricity Maps, 2026) and an illustrative energy figure. The summer and winter rows compare the worst and the best hour of the seasonal daily profile, an upper bound for the shift and not an estimate of what a real start time would save. The profile's own location-based factor of 350 g CO2e per kWh for Frankfurt (illustrative) is used for the group's reporting, not for placement.
| Option | Carbon rate, g/kWh | kg CO2e per run | Change on Frankfurt now | Eligible under PLC-HM-0001 |
|---|---|---|---|---|
| Frankfurt, annual mean | 335.4 | 604 | Baseline | Yes |
| Frankfurt, summer Tuesday 11:00 against Monday 20:00 | 155 against 376 | 279 against 677 | 398 kg, 59 per cent | Yes |
| Frankfurt, winter, 11:00 against the 15:00 peak | 349 against 408 | 628 against 734 | 106 kg, 14 per cent | Yes, if the winter profile applies |
| Cloud A, Ireland, annual mean | 301.2 | 542 | 62 kg, 10 per cent | Blocked: water unknown |
| Cloud B, France, annual mean | 32.0 | 58 | 546 kg, 90 per cent | Blocked: water unknown |
Three readings follow. The time option inside Frankfurt is real, depends on the season, and is bounded above by 106 kg in winter and 398 kg in summer for this run. The spatial options are larger but are blocked, correctly, by the water rule until the basins are looked up. Cloud A, the burst region, is only 10 per cent cleaner than Frankfurt. And the France row ignores idle capacity: the Frankfurt accelerators keep drawing power when the run leaves, so the saving to the group is less than 546 kg, and the right figure needs metering of the burst capacity that is not complete (Cloud A burst energy is unmetered, illustrative).
The group's budget for the class, EBG-HM-0004, is 9,500 kWh a month at facility boundary: about 4.33 runs of 1,800 kWh and about 1,700 kWh for fine-tuning and re-scoring runs. It is measured at the Frankfurt facility meter by the data-centre manager, and the stop path is the cluster quota and the scheduler's credential, held by the FinOps lead and the platform on-call. The policy status stays proposed until the first drill is recorded.
Practical guide: a placement policy in one page
Purpose. To turn the opening of this chapter into a record that a scheduler can read and a person can approve, without giving the scheduler the authority to change it.
Roles. Head of cloud or platform lead (owner), data-centre or energy manager (reviewer and meter), sustainability lead (reviewer of the signal), data protection officer or legal counsel (data and region floors), approver (named in the governance of Chapter 24).
Inputs. The register rows of the uses (Chapter 24), the footprint record of each batch class (Chapters 5 and 6), the regions and contracts available, the data classes each region may hold, the WEI+ of each region's basin for April to September, an hourly intensity series for each zone with its method, and the jobs' real start times and deadlines for the last month.
Steps. 1. List the classes of work and mark each interactive, queue-bound or deferrable (Table 17.2). Only deferrable classes enter the policy. 2. Write the floors per class: deadline, runtime, data classes and regions allowed, contract terms. 3. Look up the basin stress of every candidate region; leave a field empty only if it is unknown, and say so. 4. Name the signal, its method and its age limit, and say that it is not used for claims. 5. Replay one month of real jobs against the hourly series in the home region and in each eligible region, including idle capacity at the origin, and record the saving and its range. 6. Set the saving threshold from the replay; if the replay saving is under it, leave the shift off. 7. Set the energy budget, name who set it and what measures it outside the scheduler. 8. Name the stop path, test it and record the drill. 9. Write the scheduler's mandate (Chapter 15), approve, date and set the review.
Artefact. PLC-* in version control, with the replay record and the drill record linked. Evidence validity: the replay and the signal's method for 12 months, the drill for 90 days, and any change of region, supplier, contract, hardware or volume above 1.5 times reopens the policy.
Observable, expected, speculation
The labels are given where each statement is made. The differences in Table 17.1, the modest replay savings and the Swedish queue are observable; a sharper split between annual-matching claims and hourly decisions is expected, since the Commission's report names temporal matching, additionality and origin (11, European Commission, 2026); how far work can move before the grids change is speculation. The author's own projections are kept to Chapters 25 and 29.
Across the modes and the organisations
Across the degrees of delegation
Table 17.5 gives the ceiling for each action class of the scheduler. Level 4 Autonomous is never used for an action that disables the measurement, the budget or the stop path, for a move beyond a budget set by someone else, or for the publication of an environmental claim.
Table 17.5: What the scheduler of a placement policy may do, by action class. The ceilings are the starting values of Chapter 4; the Level 4 prohibitions are those of the book.
| Action class | Ceiling for the scheduler | What a person keeps | Level 4 |
|---|---|---|---|
| Measure the signal and the meters | Level 3 Bounded | Method, choice of source, annual review | Not for disabling the meter |
| Recommend a start or a region | Level 3 Bounded | The policy and its floors | Not applicable |
| Schedule within the policy | Level 3 Bounded | Approval of the policy, saving threshold, window | Never for moves beyond a budget set by someone else |
| Provision or scale compute | Level 2 Supervised within budget | Budget, approval above it | Never beyond the budget |
| Move data across a residency or sovereignty floor | None | The decision, with the data protection officer | Never |
| Stop | A gateway control, not a delegated act; may request a stop of its own run | The stop path and its drill | Never for the stop path itself |
Across the usage modes
Placement is the buyer's lever in Mode 4 and the supplier's in Modes 0 to 2, as Table 17.6 shows.
Table 17.6: Placement concern by usage mode.
| Usage mode | Placement concern |
|---|---|
| Mode 0 and 1, ambient and conversational AI | Supplier-chosen region; the buyer can ask for it and for its hourly figures (Chapter 23) |
| Mode 2, embedded assistants | The same; placement is the supplier's, and the buyer's lever is the contract |
| Mode 3, agentic work tools | Run in the platform's regions; their batch work may enter the policy |
| Mode 4, built services | The main case of this chapter: floors, windows, regions |
| Mode 5, autonomous production agents | The scheduler stays outside the agent; an agent that starts its own work does so within a budget it does not set |
Nordvik Region and Hansa Mutual
Nordvik Region has closed space and kept time off, which is a decision and not an omission. Its levers are the contract and one question to the supplier: in which bidding zone is the site, what is the hourly meter reading of the hall, and which EEA regions would it offer. PLC-NR-0001 and EBG-NR-0003 are proposed under AIDR-1317 (2032-10-26, Henrik Dahl, who answers to Elisabet Holmgren); the one-month replay is the next step. Public statements about energy per enquiry rest on Chapter 22's claim record, not on the policy.
Hansa Mutual has three regions, two of which differ by 10 per cent on the annual mean and all of which wait on a basin look-up. PLC-HM-0001 and EBG-HM-0004 are proposed under AIDR-1367 (2032-11-02, Anja Weiß, approved by the group AI governance board chaired by Dr. Annette Krämer). The first actions are the basin look-up, a metering plan for Cloud A burst capacity with Katja Neumann and Jan Berger, and a replay of eight weeks of the weekly evaluation. The figures of both organisations are illustrative and are not data.
Summary
Place and time are the fourth level of the optimisation hierarchy, and this chapter concerned E4 Operate, serving the Count and Cap tests of the net-benefit principle. The same 1,000 kWh job is associated with about 21 kg CO2e on the Swedish grid, 335 kg on the German and 677 kg on the Polish, by the annual flow-traced means of one data provider for 2025. A grid figure is a method before it is a number, and figures with different methods are not compared.
Replay studies find that carbon-aware shifting saves something real and bounded: about 31 g CO2eq/kWh, 8.4 per cent of the global average, with 24 hours of slack, and more where there is somewhere to go. Placement in a clean region is worth more than timing, and every figure is an upper bound. Water stress is a second criterion that the carbon figure does not see, and an unknown basin is treated as stressed. In the Nordic case the grid is clean and flat, timing buys little, and the scarce resource is the connection: 8,200 MW of data-centre applications sat in Svenska kraftnät's queue on 1 November 2026.
The placement policy PLC is the artefact. It puts floors first, applies a saving threshold, treats water as a condition for moving in, names its signal and limits it to placement, and gives the scheduler a mandate at Level 3 Bounded, with a budget measured outside the scheduler and a stop path that does not run through it. PLC-NR-0001 keeps space closed and time off until a replay says otherwise; PLC-HM-0001 allows a bounded shift for the weekly evaluation inside Frankfurt and blocks the regions whose basin stress is unknown. A reader can start with one batch class, replay a month of its jobs against hourly data and write the policy. Chapter 18 turns from the placement of work to the data centre that receives it, and to the grid connection that decides whether the capacity exists at all.
Sources
- Sukprasert, T., Souza, A., Bashir, N., Irwin, D. and Shenoy, P. (2024). On the Limitations of Carbon-Aware Temporal and Spatial Workload Shifting in the Cloud. EuroSys '24, arXiv:2306.06502. Retrieved November 2026. (116, Sukprasert et al., 2024)
- Electricity Maps. (2026). Electricity Grid Review 2025, country pages for Sweden, Finland, France, Ireland, Germany and Poland. Commercial data provider. Retrieved November 2026. (41, Electricity Maps, 2026)
- European Environment Agency. (2026). Greenhouse gas emission intensity of electricity generation in Europe. Indicator page, 9 November 2026. Retrieved November 2026. (155, European Environment Agency, 2026)
- Google. (2026). 2026 Environmental Report. Vendor-reported. Retrieved November 2026. (43, Google, 2026)
- Svenska kraftnät. (2026). Information om pågående anslutningsärenden, statistics as at 1 November 2026, page reviewed 10 November 2026. Retrieved November 2026. (39, Svenska kraftnät, 2026)
- European Environment Agency. (2025). Use of freshwater resources in Europe. Indicator page. Retrieved November 2026. (114, European Environment Agency, 2025)
- Radovanovic, A. et al. (2021). Carbon-Aware Computing for Datacenters. arXiv:2106.11750, abstract read. Retrieved November 2026. (117, Radovanovic et al., 2021)
- European Commission. (2026). Report on the energy efficiency of data centres in the EU, COM(2026) 500 final, 21 September 2026. Retrieved November 2026. (11, European Commission, 2026)
- European Parliament and Council of the European Union. Regulation (EU) 2016/679 (General Data Protection Regulation), Article 44. (3, European Union, 2016)
- Nordqvist, G. AI Platform and Security, Chapter 13; AI Operations, Chapter 11; AI Governance, Chapter 6. The Transformed Architecture, Books 3, 10 and 2. (27, Nordqvist, 2026) (34, Nordqvist, 2026) (26, Nordqvist, 2026)