The Footprint of a Model: Training, Inference and Embodied Impact
Chapter 5 opens Part II and the first function of the method, E1 Measure: counting the footprint of models, uses, agents and hardware at a stated boundary, year and method. It starts with the model, because the model is where most published figures begin and where most confusion about them begins. A model is a trained set of numerical parameters (its weights) that many uses share. Its footprint has four parts: training, the smaller adaptation that follows, operation over its service life (inference, the work of answering a request), and the hardware that all three run on, whose manufacture is called embodied impact. Figure 5.1 shows the stages and the allocation rule that joins them; a later section shows how life cycle assessment applies to them. The chapter is the Count test of the net-benefit principle (Chapter 4) applied to the shared asset. Chapter 6 then applies it to the unit that decisions are made on, the use.
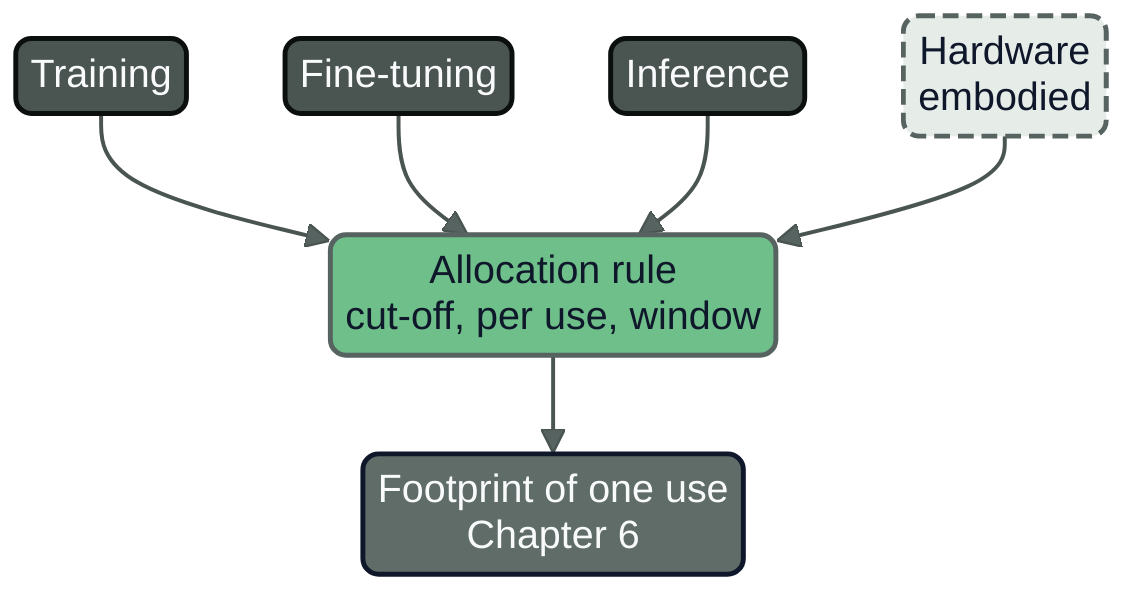
Figure 5.1: The life of a model. Every stage is counted at a stated boundary and year; the allocation rule decides how much of the shared stages a single use carries. No figure is carried between stages without its boundary.
A number in a model card
Meta's model card for Llama 3.1 reports that training the three sizes of the model used 39.3 million accelerator hours on H100-class hardware rated at 700 W, of which 30.84 million were for the 405-billion-parameter model. For that model it gives two figures for the greenhouse gas emissions of training: 8,930 tonnes of carbon dioxide equivalent (CO2e) on a location-based basis, and 0 tonnes on a market-based basis (69, Meta, 2024). Both are correct on the card's own terms, and the card says why. A location-based figure multiplies the electricity used by the average emission factor of the grids that supplied it. A market-based figure credits the electricity that the company has contracted from renewable sources; the card states that Meta has matched 100 per cent of its electricity use with renewable energy since 2020 and that its global operations are at net zero greenhouse gas emissions (69, Meta, 2024). The two methods come from the Scope 2 Guidance of the Greenhouse Gas Protocol, which also sets the quality criteria that a contractual instrument must meet before the market-based method may use it (73, GHG Protocol, 2015).
A buyer who reads only the second figure learns that Meta's contracts cover its consumption, and nothing about the grid electricity drawn. A reader of only the first learns the physical footprint at average grid factors and nothing about the contractual position. The card is vendor-reported, covers one stage of one model family and was published in 2024; it was read in November 2026. A figure of 0 and a figure of thousands of tonnes sit side by side for the same run, and the difference is a definition, not an error. The first discipline of E1 Measure is therefore to carry the basis with every figure, and to ask for both where both exist.
The card also leaves things unsaid. It gives accelerator hours and a rated power, but not the energy, the utilisation or the emission factor. Multiplying 30.84 million hours by 700 W gives 21.6 gigawatt hours, and 8,930 tonnes over that is about 410 g per kWh. The card describes the 700 W as peak device power adjusted for power usage effectiveness (the ratio of a data centre's total energy to the energy that reaches its IT equipment), so the result is an order of magnitude, not a reconstruction. It does not say whether the 39.3 million hours include fine-tuning, annotation and evaluation, or whether hardware manufacture is counted (69, Meta, 2024).
Training
How a training figure is built
A training figure is a product of four things. The first is accelerator hours: the number of accelerators (the graphics processors or similar chips that carry the computation) multiplied by the hours reserved for the run. The second is the average power each accelerator drew, measured at the rack or estimated from rated power and a utilisation assumption. The third is facility overhead, expressed as power usage effectiveness (PUE): cooling, power conversion and other loads above the IT equipment's energy. The fourth is the emission factor of the electricity, on the two bases described above. Energy is the first three multiplied together; emissions are energy multiplied by the factor. Every disclosure is this arithmetic with some factors measured, some estimated and some left out.
The study of the BLOOM language model gives all the factors the Meta card leaves out: 433 megawatt hours of dynamic (computation-driven) consumption on the Jean Zay cluster in France, a PUE of 1.2, a grid factor of 57 g per kWh, and 24.7 tonnes of CO2e for the final training run when only dynamic consumption of the accelerators is counted (70, Luccioni et al., 2022). That study is an estimate by researchers who took part in the BigScience project (not a vendor) and had access to the cluster's records, and it was published in 2022. It is useful here because it states what each choice does.
What the usual figure leaves out
The same study counts what the headline number does not. Adding the idle consumption of the cluster (machines switched on but not computing) and the embodied emissions of the hardware raises the figure for the final run from 24.7 to 50.5 tonnes: 11.2 tonnes embodied (22.2 per cent), 24.7 dynamic (48.9 per cent) and 14.6 idle (28.9 per cent). The authors also counted the rest of the project, which trained several other models and ran evaluations: 66.3 tonnes of CO2e in dynamic consumption in all, of which the final BLOOM run was 37 per cent, and 123.8 tonnes with embodied emissions and idle consumption (70, Luccioni et al., 2022). The best-known figure, 24.7 tonnes, is therefore about a fifth of the project's footprint at its widest boundary, and the study notes that the models also emit during deployment, which it could not account for.
The book's own conclusion from this one study, not a measured average, is that a training figure for a final run excludes at least four things: the experiments and failed runs before it, the idle and overhead energy of the cluster, the manufacture of the hardware, and the data preparation. A provider that states the boundary has done what E1 Measure asks; one that states none has given a number usable only as context.
The basis of a training figure
Training is a single event on specific hardware, so the location-based figure depends on where the run took place. The BLOOM run used a grid at 57 g per kWh; the same energy at 394 g per kWh, the factor the study used for a US cloud region, would have emitted about seven times as much. A buyer cannot correct for this without the energy in kilowatt hours, which is why the energy belongs on the model footprint sheet described later. The market-based figure depends on contractual instruments that may be bought for an annual period unconnected with the hour or place of the run; Chapter 22 treats the reporting consequences.
Fine-tuning and adaptation
Fine-tuning continues the training of an existing model on a smaller, task-specific data set. Its footprint is counted the same way as training, with the same four factors, and is usually small against pre-training. In the Hansa Mutual example below (illustrative), a classifier fine-tuned from an open-weight base model used 240 accelerator hours in its final run.
Four conditions make fine-tuning large enough to count on its own. First, many runs: the search for good settings repeats the training, and the Hansa example shows the final run to be only 17 per cent of the accelerator hours counted for the model. Second, repetition: the benefits-triage system of Nordvik Region is retrained four times a year, and each retraining is a training event of that use (Chapter 14). Third, a large base model with all parameters updated. Fourth, data generated by another model: the Llama 3.1 card reports over 25 million synthetically generated fine-tuning examples (69, Meta, 2024), and generating them is inference with a footprint that no figure on the card isolates. A fine-tuning record states the number of runs, the accelerator hours of the final run and of all runs, and any data generation, so that a reader sees whether the number is the run or the effort.
Inference over the life
Inference is the operation of the trained model: each request it answers uses energy. Over the model's service life the footprint is the footprint per request multiplied by the number of requests, plus the energy the system uses while waiting, which is large for models kept ready in memory. The BLOOM study measured one deployment: 230,768 requests over about 18 days on a cloud instance with 16 accelerators, 914 kWh of electricity, 75.3 per cent of it in the accelerators. In ten-minute intervals with almost no requests the instance still used about 0.28 kWh, close to its mean draw, and the authors report about 19 kg of CO2e per day at 394 g per kWh (70, Luccioni et al., 2022). Dividing 914 kWh by 230,768 requests gives about 4 Wh per request (the author's arithmetic) at the boundary of the metered instance, with no facility overhead stated; the figure is high because the instance was mostly waiting, with no batching and a modest request rate.
Two other figures sit on other boundaries. A measurement of a production service in May 2025 put the energy of a median Gemini text prompt at 0.24 Wh, counting accelerators, host, idle capacity and data-centre overhead, and excluding training, external networking and end-user devices (51, Elsworth et al., 2025). It is vendor-reported, from fleet-average conditions. A 2026 bottom-up model estimates a median of 0.39 Wh per query for Llama 3.1 405B on a whole eight-accelerator H100 node with facility overhead, steady state, and notes that most published measurements are accelerator-only (52, Oviedo et al., 2026). It is an estimate from authors at Microsoft, not a measurement. The two are not comparable, and neither includes training, so how training is attributed to a use is open in both. Chapter 6 reads them as figures of a use.
Training against inference
Whether lifetime inference exceeds training depends on volume, utilisation and grid, and cannot be settled for a model in general. The BLOOM figures show one case. At the deployment's trial load, 19 kg a day reaches the 24.7 tonnes of the final run's dynamic consumption in about 1,300 days (3.6 years) and the 50.5 tonnes of the widened boundary in about 7.3 years; in energy terms, the 433 megawatt hours of training equal about 23 years of that load. These are the author's calculations from two figures of one paper on different boundaries (training: accelerators' dynamic consumption; deployment: whole instance including idle), made to show which parameters decide the result, not to estimate BLOOM's life.
The same arithmetic shows how scale changes the answer. Taking the 21.6 gigawatt hours above as the order of magnitude of Llama 3.1 405B training and the modelled 0.39 Wh per query of Oviedo and colleagues, the energy of training is that of about 55 billion queries: about 55 days at a billion queries a day, the volume that paper uses as its example of a large service, and more than 15 years at ten million a day. This is an illustrative calculation across two sources and boundaries. It supports one conclusion: for a model with many users, training may be the larger part of the footprint in its first period and a smaller part of its life, and a single organisation's volume is a very small share of either. Mistral's study of Mistral Large 2 does not separate the two. It reports 20.4 kilotonnes of CO2e, 281,000 cubic metres of water consumed and 660 kg of antimony equivalent for training plus 18 months of use up to January 2025, location-based, including upstream server manufacture (45, Mistral AI, 2025); the 18-month window is itself an allocation rule.
Embodied impact
Embodied impact is the greenhouse gas emitted, and the resources used, to make the hardware: mining and refining, manufacturing of chips and memory, assembly and transport. It is counted once and spread over the hardware's working life. The evidence is thin and comes in three kinds with different boundaries, which cannot be added.
The manufacturer's product carbon footprint is the first. NVIDIA reports, for one HGX H100 baseboard carrying eight accelerators, 1,312 kg CO2e from raw material extraction to final assembly (cradle-to-gate), of which high-bandwidth memory was 42 per cent and integrated circuits 25 per cent; use and end of life are excluded, and the footprint was commissioned from a consultancy under an ISO-conformant, third-party reviewed method (46, NVIDIA, n.d.). For the HGX B200 baseboard the figure is 2,274 kg (71, NVIDIA, 2025). Both are vendor-reported, for a baseboard and not a complete server. Dividing by eight gives 164 kg and 284 kg per accelerator; that arithmetic is the author's, and gives no basis to compare generations, because a newer baseboard holds more memory.
An independent teardown is the second. A life cycle assessment of the NVIDIA A100 SXM 40 GB card, with primary data, found 127.6 kg CO2e per card cradle-to-gate (82.3 per cent from the chip and its memory) and 141 kg when distribution and disposal are included (72, Falk et al., 2025). For the training of GPT-4 it finds that the use phase dominates ten of sixteen impact categories (96 per cent of climate change) and manufacturing dominates six, including human toxicity and freshwater eutrophication, so a carbon-only figure misses the categories in which manufacturing dominates. It is a preprint.
An operator's study of its own hardware is the third. Google researchers report manufacturing and use for five generations of tensor processing units, with embodied emissions of 386 to 1,101 kg CO2e per TPU chip (including its share of the host machine and of data-centre construction) over a six-year life, and find operational emissions about 70 per cent of lifetime emissions when the operator's carbon-free-energy procurement is counted (market-based) and about 90 per cent when it is ignored (55, Schneider et al., 2025). The embodied share therefore changes with the electricity basis, because the embodied term is fixed and the operational term is not. It is a preprint by the operator on its own hardware.
The research for this book found no complete-server figure for an AI server that could be read at the source. BLOOM's authors used 150 kg per accelerator from secondary sources (70, Luccioni et al., 2022). Embodied carbon per accelerator is known to within a factor of two or three for the cards that have been assessed, and unknown for the server, the network and the building around it. An organisation that must account for it states its source and what it leaves out. Chapter 7 reads the same hardware figures for materials and Chapter 16 for hardware life.
Allocation choices
The allocation problem is how a share of a shared, one-time or long-lived footprint is attributed to one use. It arises for training, for fine-tuning and for hardware, and it has three parts.
The first is time, the period over which the footprint is spread. A card's embodied emissions are spread over its working life; a three-year life puts twice as much on each hour of use as a six-year life. Training is spread over the service life of the model, which is not known when the model is released. The second is volume, the number of uses that share the footprint: ten billion requests put a hundred times as much on each as a trillion. The third is share, how much of the shared resource this use takes. A use that reserves a quarter of a machine carries a quarter of its embodied emissions, and utilisation decides whether the unused three quarters are allocated to anyone.
The Software Carbon Intensity specification, adopted as ISO/IEC 21031:2024, gives the hardware rule: the share of embodied emissions is the total embodied emissions multiplied by a time-share (the time the hardware is reserved divided by its expected lifespan) and a resource-share (the resources reserved divided by the total) (21, Green Software Foundation, 2024). It does not fix a rule for the training of a model. AI Platform and Security, Chapter 22 applied the specification to the citizen FAQ service of Nordvik Region (illustrative, October 2026): 1,970 kWh, a PUE of 1.15, 32 g per kWh location-based, 62,400 g of embodied emissions and 71,000 resolved enquiries give 1.90 g of CO2e per enquiry (27, Nordqvist, 2026). The embodied term is 0.88 g, or 46 per cent. At 350 g per kWh the same workload scores 12.05 g and the embodied term is 7 per cent. The cleaner the grid, the more the allocation of hardware decides the result, which is why the Region's baseline profile lists its embodied allocation as an unsourced rule.
Three rules for the training footprint
Three rules are in use for attributing a model's training to a use. The names are this book's, and the choice is a decision the organisation records.
- Cut-off. The user carries none of the pre-training, only its own fine-tuning and inference. The Llama 3.1 card takes this view when it says that, because the models are openly released, the training energy and emissions "will not be incurred by others" (69, Meta, 2024). It is right when the question is the cost of the organisation's own decisions, and understates what the existence of the model costs.
- Per use. The training footprint is divided by the expected lifetime number of uses of the model, and the use carries its count. It matches the unit of decision (Chapter 6) but a buyer cannot compute it, since only the provider knows the lifetime volume; if the volume falls short, the footprint is not fully recovered.
- Time window. The training footprint is divided by a fixed window, such as the 18 months of the Mistral study (45, Mistral AI, 2025) or the service life of a model version, and each period carries its share, divided among the uses by their share of traffic. The footprint is fully allocated by the end of the window whatever the volume.
For a model with many users the choice moves the per-use figure by orders of magnitude. Table 5.1 shows the sensitivity of the per-use rule for Llama 3.1 405B at the location-based figure of its card. It is a calculation, not a finding: nobody outside the provider knows the number of queries.
Table 5.1: Training share per query of Llama 3.1 405B under three assumed lifetime volumes. Training only, location-based, 2024 card, vendor-reported (69, Meta, 2024); 8,930 t divided by volume. A calculation by the author, not a measurement.
| Expected lifetime queries | Training share per query (g CO2e) |
|---|---|
| 10 billion | 0.89 |
| 100 billion | 0.089 |
| 1 trillion | 0.0089 |
Practical guide: how to allocate and record the rule
Purpose. Make the allocation a recorded decision with a sensitivity, not an unstated default.
Roles. The sustainability lead owns the method; the platform engineer supplies hours, energy and volume; the finance practitioner supplies the hardware life; the auditor reviews the record.
Inputs. Accelerator hours, metered energy, the PUE, the emission factor on both bases, hardware embodied emissions and life, utilisation, the expected lifetime volume.
Steps. (1) Count the training at the widest boundary the data supports and state the boundary. (2) Choose one of the three rules and write down why. (3) Compute the per-use share under the other two rules and keep the range. (4) State the evidence for the embodied figure and its life, and compute the effect of the shortest and longest plausible life. (5) Set a review date; a rule that depends on the expected volume is reviewed when the volume deviates.
Artefact. The model footprint record below.
Hardware assumptions can be bounded the same way: the A100 study varies life from one to four years and utilisation from 50 to 85 per cent (reference 100 per cent), and the manufacturing-dominated categories vary by up to about 300 per cent of the reference value (72, Falk et al., 2025). The function below applies the three rules and gives the share a use carries in one period.
"""Share of a model's training footprint carried by one use in one period."""


def allocated_kg(total_kg: float, rule: str, *, uses_in_period: float,
                 expected_uses: float | None = None,
                 window_months: float | None = None,
                 period_months: float = 1.0, traffic_share: float = 1.0) -> float:
    if rule == "cut_off":
        return 0.0
    if rule == "per_use":
        return total_kg * uses_in_period / expected_uses
    if rule == "time_window":
        return total_kg * (period_months / window_months) * traffic_share
    raise ValueError(f"unknown rule: {rule}")


if __name__ == "__main__":
    total = 437.7  # kg CO2e: training 425.2 plus embodied 12.5 (illustrative)
    plan = 210_000 * 24
    for uses in (210_000, 105_000):  # planned volume, then half of it
        for rule in ("cut_off", "per_use", "time_window"):
            kg = allocated_kg(total, rule, uses_in_period=uses,
                              expected_uses=plan, window_months=24)
            print(f"{uses:>7} uses  {rule:<11} {kg:6.1f} kg  "
                  f"{kg * 1000 / uses:.4f} g per use")
At the planned volume the per-use and time-window rules agree. When the volume halves, the per-use rule carries half the footprint in the month and leaves a remainder unallocated at the end of the window, while the time-window rule keeps the monthly share and doubles the figure per use. The record states the rule so that a figure per use is read correctly.
What providers disclose
Disclosure comes from four kinds of document: model cards, lifecycle assessments of a model, per-request figures for a service, and product carbon footprints of hardware. Table 5.2 reads the sources used in this chapter, each at its stated boundary, and never ranks them. All were retrieved in November 2026.
Table 5.2: Published disclosures read in this chapter, each at its own boundary. The rows must not share an axis.
| Disclosure | Boundary | Year | Source and kind |
|---|---|---|---|
| Llama 3.1 405B training: 8,930 t location-based, 0 t market-based | Pre-training; other stages not broken out | 2024 | Meta model card (69, Meta, 2024); vendor-reported |
| Mistral Large 2: 20.4 kt CO2e, training plus 18 months of use | Lifecycle, location-based; GPU embodied approximated | To January 2025 | Mistral AI (45, Mistral AI, 2025); vendor-reported, consultancy-reviewed |
| Gemini Apps median prompt: 0.24 Wh | Whole serving stack; excludes training, networking, end-user devices | May 2025 | Elsworth et al. (51, Elsworth et al., 2025); vendor-reported |
| Llama 3.1 405B median: 0.39 Wh per query (IQR 0.19 to 0.68) | Modelled eight-accelerator node with overhead, steady state | 2026 | Oviedo et al. (52, Oviedo et al., 2026); estimate, authors at one vendor |
| HGX H100 baseboard 1,312 kg; HGX B200 2,274 kg CO2e | Cradle-to-gate baseboard; use and end of life excluded | 2025 | NVIDIA (46, NVIDIA, n.d.) (71, NVIDIA, 2025); vendor-reported, third-party reviewed |
| A100 card 127.6 kg cradle-to-gate; 141 kg with distribution and disposal | One card, primary data, climate change category | 2025 | Falk et al. (72, Falk et al., 2025); independent preprint |
| BLOOM final run 24.7 t dynamic, 50.5 t with embodied and idle | One model, one cluster | 2022 | Luccioni et al. (70, Luccioni et al., 2022); authors took part in the project |
What the AI Act asks of a provider
The AI Act (Regulation (EU) 2024/1689, in the consolidated text that includes Regulation (EU) 2026/1744) (1, European Union, 2024) (2, European Union, 2026) requires, in Article 53(1)(a), that a provider of a general-purpose AI model keep technical documentation with at least the information of Annex XI, for the AI Office and the national competent authorities on request. Annex XI, Section 1, point 2(e), lists the "known or estimated energy consumption of the model" and allows the figure to be based on the computational resources used where the energy is unknown. Annex XII, which lists what the provider gives to downstream providers that integrate the model, contains no item on energy. Article 53(2) exempts providers of models under a free and open-source licence with public parameters from points (a) and (b), but not where the model has systemic risk. Article 53(5) empowers the Commission to adopt delegated acts on measurement and calculation methodologies for the energy items, and Article 40(2) requires the standardisation request to cover the energy-efficient development of general-purpose AI models. Chapter 21 treats these provisions in full. The implication here is that the energy of a model is documented to authorities, not to buyers, and open-weight models may carry no such documentation.
The Model Documentation Form of the General-Purpose AI Code of Practice (9, European Commission, 2025) (74, European Commission, 2025) makes this concrete. It asks for the energy used for training in megawatt hours with at least two significant figures, allows "N/A" where critical information from a compute or hardware provider is lacking, and, for inference, asks for a benchmarked amount of computation in floating-point operations for a described task on described hardware, not for energy. Its energy rows are marked for the AI Office and the national authorities and are not marked for downstream providers. The form records that no delegated act under Article 53(5) existed when it was written; none was found adopted by November 2026. A deployer has no direct energy duty under the Act, so a buyer that wants the figures writes them into the contract (Chapter 23).
Life cycle assessment applied to AI
Life cycle assessment (LCA) is the standardised method for counting the environmental impacts of a product system from raw materials to disposal. This section, part of E1 Measure, sets out what the method requires, how the AI-specific guideline applies it, and what a footprint record must carry before it is called an LCA.
What the standards require
ISO 14044:2006, read with ISO 14040:2006, sets the requirements (23, ISO/IEC, 2006) (22, ISO/IEC, 2006); the text read here was a national adoption of the 2006 edition, and later amendments were not checked. An LCA has four phases: goal and scope, inventory, impact assessment (converting inventory flows into indicators per category, such as climate change) and interpretation. The functional unit is the quantified function to which all inputs and outputs are normalised, and must be clearly defined and measurable. The system boundary states which processes belong to the study. Cut-off criteria state what may be left out, and their effect must be assessed. Allocation, the division of shared burdens between products or uses, is to be avoided by subdividing the process or expanding the system; where several procedures seem applicable, a sensitivity analysis is required. Data quality requirements cover time, geography, technology, precision and completeness.
A public comparative assertion is held to more. An inventory alone cannot support it; the indicators must be comprehensive, compared category by category and not weighted into a single score; and a critical review is required, by a panel of at least three chaired by an independent external expert. This is the method's counterpart of the book's rule that an unproven benefit is never offset against a measured footprint (Chapter 4).
ITU-T L.1801: the method applied to AI
Recommendation ITU-T L.1801, approved on 6 February 2026 and in force, is the AI-specific guideline (78, ITU, 2026). It is voluntary and applies the ICT method L.1410 (2024) and, for effects on other sectors, L.1480 (2025); only what L.1801 says of them was read. Four points matter.
- Stage mapping. Hardware production, design, development, verification and initial training map to the production stage; deployment, operation, inference and continuous learning map to the use stage. Initial training is also reported separately.
- Allocation. Shared infrastructure is allocated to users by usage, by energy or time. A foundation model's embodied and pre-training impacts are allocated by estimated inference volumes and number of derived models, with a warning to proceed with caution; no training rule is agreed, so the rule and its sensitivity stay a recorded decision.
- Categories. Climate change is mandatory; water use, resource use and land use are named as further categories, and the choice is the practitioner's. A carbon-only study says so, since the dominant stage changes with the category (72, Falk et al., 2025).
- Reporting and comparison. The report states a full or partial compliance. A comparison of an AI system with a non-AI reference, or of two AI systems, uses the same unit, boundary, data quality, allocation and cut-off; rebound follows L.1480 as a separate step, covering greenhouse gases only. Clause 8.1.6 of L.1801 is titled "Reporting and critical review" but states no review panel rule; in the author's reading ISO 14044 governs a public comparison.
The functional unit and the per-use unit
L.1801 asks for what, how much, how long and to what quality. For text generation it counts prompt, generated and reasoning tokens, and an intensity per prompt "may qualify as a functional unit" when it includes full life cycle impacts. Its examples omit quality, so a condition such as "answer accepted without correction" is the practitioner's to add. The per-use unit of Chapter 6 is an intensity of this kind, operational by default; it becomes an LCA functional unit only when the allocated training, embodied and end-of-life shares are added. For a public authority the natural unit is a service outcome, such as a case decided, with tokens as the reference flow (the amount of product that fulfils the unit), in the author's reading.
Electricity, hardware life and screening
The European Commission's Product Environmental Footprint (PEF) method uses the country-specific residual consumption mix (the unclaimed mix) in the use stage and accepts supplier-specific electricity only when criteria are met (161, European Commission, 2021); report both bases and name the one that drives the figure. L.1801 fixes no hardware lifetime: a server study uses four years (150, Dell Technologies, 2025) and the TPU study six (55, Schneider et al., 2025), so lifetime is a sensitivity parameter, shown for the classifier below.
A screening LCA is defined only in the PEF method: available primary or secondary data may be used, no cut-off is allowed, impact assessment is included and the step is iterated (161, European Commission, 2021). ISO 14044 and L.1801 do not use the word. The book's own working rule is that a screening LCA can inform an internal decision and cannot support a public comparison.
What is and is not standardised
No ISO or CEN standard for the LCA of AI was found. A draft European standard, prEN 18287:2026, is in preparation by CEN/CLC/JTC 21. The DIN project page was read (162, DIN, 2026), and a catalogue entry gives its stage as public enquiry, closing on 23 December 2026 (77, CEN/CENELEC, 2026); the text of the draft was not read. The Software Carbon Intensity for AI specification is a carbon rate per unit, not an LCA (75, Green Software Foundation, 2026). Observable: L.1801 is the only AI-specific method in force that the research found. Expected: the European draft, once adopted, will give a CEN text to cite; the catalogue entry gives 17 March 2027 as a due date, and whether the AI Act will refer to it is not established.
Published studies as boundary examples
Mistral reports, for a 400-token response in its chat service excluding users' terminals, 1.14 g CO2e, 45 mL of water and 0.16 mg of antimony equivalent (three categories), and states conformity with ISO 14040/44 (45, Mistral AI, 2025). The conformity is self-declared, the page does not say whether its two-consultancy review met ISO 14044, and the full report was not found. A study of the Moshi model counts early experiments, failed runs and ablations (163, López-Rauhut et al., 2026); only its abstract was read. These show boundaries, not proof. No LCA of an AI service by a public authority with a critical review was found.
What the footprint record carries
A footprint record (FPR) is an inventory with a limited set of categories, not an LCA. An LCA adds a full impact assessment, interpretation and, for public comparison, review. Table 5.3 shows where each element is carried; the record below adds the lca_frame fields.
Table 5.3: Elements of an LCA and where the book's records carry them. The mapping is the author's.
| Element | What the standards ask | Carried in |
|---|---|---|
| Functional unit | Measurable, with quality | FPR functional_unit |
| Boundary, stage mapping | Stages named; training under production | FPR boundary, stage_mapping |
| Cut-off, allocation | Effect assessed; sensitivity shown | FPR excluded, allocation |
| Categories | Climate change at least | FPR categories |
| Data quality, uncertainty | Sources, time, geography, range | FPR evidence |
| Compliance statement | Full or partial | FPR lca_status |
| Comparison, rebound | Same unit; second-order effects apart | Benefit record (Chapter 9) |
| Public comparison | All categories, no weighting, review | Claim record (Chapter 22) |
What a buyer can do
A buyer that does not train a model has three uses for a model-level figure. It is a screen: a provider that discloses training energy with a boundary is more likely to hold the evidence behind a per-use figure. It is an input to an allocation, since any rule other than cut-off needs the provider's figure and, for the per-use rule, its volume. And it is context: the scale of what the model cost to make, not the unit of decision. The unit of decision is the use (Chapter 6), and a model-level figure never answers whether a use is worth its footprint. Record what could not be obtained as a dated gap and ask again at each contract review; a missing figure is a finding.
Practical guide: a model footprint sheet
Purpose. Give a buyer one page to send to a provider, and a record of the answer.
Roles. The sustainability lead prepares it; the procurement officer sends it and holds the reply; the platform engineer checks the figures that can be tested against telemetry; the auditor reviews the gaps.
Inputs. The model and version in use, the contract, the AI gateway's telemetry, the provider's model card and environmental report.
The eight fields. (1) The model and version, with release date. (2) The training energy in megawatt hours and the boundary: final run only or all runs, accelerator power only or including facility overhead. (3) The training emissions on both bases, with the factors and their year. (4) The hardware and training time: accelerator type, number and hours, so that the buyer can re-estimate. (5) The inference energy for a stated task: tokens in and out, hardware, batching, accelerator-only or whole system, median or mean. (6) The embodied emissions: whether included, the hardware life and the amortisation rule. (7) The serving location and its grid and water conditions, at least the country and the data-centre operator. (8) The evidence: vendor-reported or independently checked, the method, the date and the next update.
Steps. Fill what is public; send the sheet for the rest with a reply date; record each field as given, partial or missing; keep the reply in version control; repeat at each contract review.
Artefact. The sheet below, a model footprint record with a status per field. Evidence age: a supplier disclosure is valid for 12 months, after which the field is marked expired (illustrative convention, Chapter 4).
Worked example: two model cards compared at their stated boundaries
The headline numbers of the Llama 3.1 card and the Mistral Large 2 study, 8,930 tonnes and 20.4 kilotonnes, cannot be compared (Table 5.2). The first is training alone, on two bases, with hardware manufacture not stated. The second is training plus 18 months of use, location-based, with upstream server manufacture included and GPU embodied impacts approximated because, the study says, no reliable inventory exists (45, Mistral AI, 2025). Their ratio has no meaning, and neither says which model is the smaller footprint to use.
The model footprint record
The record below belongs to Hansa Mutual and counts the training of a model it fine-tuned itself, in full. All figures of the two organisations are illustrative. The model is the sensitivity classifier of the classification-routed hybrid set-up (it decides nothing: it flags a request as sensitive or not, and the routing policy acts on the flag). It is the first record of the model scope; a use-scope record follows in Chapter 6. The identifier FPR-HM-0007 is the first free number after the six use records of the profile. The metering is that of the Frankfurt rack counters; the grid factor of 350 g per kWh is the profile's location-based figure.
record: FPR-HM-0007
scope: model                    # model, use or agent
status: illustrative
model: claims-route-classifier
version: "2032.2"
base_model: open-weight, about 1 billion parameters; provider card gives accelerator hours only
used_by: [FPR-HM-0003]
as_of: 2032-09-30
training:
  runs_counted: 11              # 1 final run and 10 earlier runs (search and one failed run)
  accelerator_hours: {final_run: 240, all_runs: 1420}
  it_energy_kwh_all_runs: 880   # metered at rack level, host included
  pue: 1.38
  facility_energy_kwh_all_runs: 1215
  emissions_kgco2e:
    location_based: {value: 425, factor_g_per_kwh: 350, factor_year: 2032}
    market_based: {value: 85, method: unmatched 20 per cent at the location-based factor}
  final_run_only_kgco2e_location_based: 72
  excluded: [data preparation, evaluation outside the platform]
pre_training_of_base_model:
  rule: cut_off
  provider_figure: accelerator hours only; no energy and no emissions
embodied:
  accelerator_kgco2e_each: 200  # assumption in the order of published per-card figures
  lifespan_years: 5
  utilisation: 0.52
  allocated_kgco2e: 12.5
  rule: reserved hours divided by life and by measured utilisation
inference:
  energy_per_use_wh: null       # gateway meter planned for 2032-11
allocation:
  rule: time_window
  window_months: 24
  expected_uses: 5040000        # 210,000 a month
  sensitivity_g_per_use: {per_use: 0.087, time_window: 0.087, cut_off: 0.0}
lca_frame:                      # fields of Table 5.3; the record is an inventory, not an LCA
  lca_status: inventory with one category (climate change); no review
  guideline_mapping: ITU-T L.1801 (02/2026), mapping only
  functional_unit: one training of version 2032.2, all 11 runs
  boundary: rack-metered IT energy times PUE, plus allocated embodied; no data preparation
  stage_mapping: training and embodied to production stage; inference to use stage (FPR-HM-0003)
  categories: [climate change]
  embodied_life_sensitivity_kgco2e: {years_3: 20.8, years_5: 12.5, years_6: 10.4}
evidence:
  metered_by: Katja Neumann
  method_owner: Dr. Verena Lindner
  basis: own metering, not independently verified
  review_by: 2033-01-04
The record counts the 11 runs: the final run emitted 72 kg CO2e location-based and the 11 runs 425 kg, so a card reporting the final run alone would be 83 per cent short of the effort. The market-based 85 kg uses a simplification (the unmatched share at the grid average, where the residual mix is higher) and is labelled so. The per-use figures, 0.087 g under both rules at the planned volume, come from the function above. The lca_frame block states the record's standing: one category and no review, so it supports internal decisions and no public comparison. Holding the reserved hours fixed, the embodied term moves from 10.4 to 20.8 kg across lives of six and three years (the author's arithmetic).
Across the modes and the organisations
Across the usage modes
Table 5.4 shows who can count each part of a model's footprint in each usage mode.
Table 5.4: Who can count each part of a model's footprint, by usage mode.
| Mode | Who can count training | Who can count inference | What the buyer can do |
|---|---|---|---|
| Mode 0 Ambient AI | Provider only | Provider only | Declare the row as supplier-reported; ask the sheet in the contract |
| Mode 1 Conversational assistants | Provider only | Provider only; per-prompt figures where published | Count seats and tokens; ask fields 1, 5 and 7 |
| Mode 2 Embedded workplace assistants | Provider only; the model may not be named | Provider only | Ask for model identity first, then the sheet |
| Mode 3 Agentic work tools | Provider | Buyer's telemetry counts sessions and tokens; calls multiply per task (Chapter 15) | Count at the gateway; attribute by session |
| Mode 4 Built AI applications | Provider or the buyer's own fine-tuning (counted in full) | The buyer, on its own or reserved capacity | Own meter; the full record |
| Mode 5 Autonomous production agents | As Mode 4 | As Mode 4, with a run multiplier | The record plus a budget (Chapter 15) |
Measurement is not delegated to the system measured. The meter and the record sit outside any agent whose footprint they count, and Level 4 Autonomous is never used for an action that disables the measurement or for publishing an environmental claim built from these records.
Nordvik Region and Hansa Mutual
Hansa Mutual fine-tunes an open-weight classifier on its own Frankfurt platform and can count the run in full, as FPR-HM-0007 shows: metered rack energy, a PUE of 1.38 after the cooling failure of 2027, 11 runs, both electricity bases, and an embodied term. Dr. Verena Lindner owns the method and Katja Neumann the metering, as in the environmental profile. It cannot count the pre-training of the base model, for which the provider gives accelerator hours only; it applies the cut-off rule and says so in the record. The gaps at baseline are the classifier's own inference energy, not yet metered, and the market-based position of a single run, which the group method allocates annually.
Nordvik Region buys. The hosted model that answers the eligibility-explanation route (FPR-NR-0002, about 22,000 explanations a month, 13 per cent of enquiries) has no training figure, no per-request energy and no named site, so the Region can count only the use, and only partly. Astrid Nyberg prepared the sheet below and Ida Pettersson sent it to the supplier through the framework on 6 October 2032, with a reply due on 30 November. At issue, one of the eight fields is given, one is partial and six are missing. The open-weight model of the staff assistant, on reserved accelerators (utilisation 0.58 in the third quarter of 2032), has the opposite gap: the Region meters inference itself and holds only the provider's card for training.
sheet: FPR-NR-0007
scope: model
status: illustrative
purpose: model footprint sheet for the hosted model of the eligibility-explanation route (FPR-NR-0002)
prepared_by: Astrid Nyberg
sent_by: Ida Pettersson
sent: 2032-10-06
reply_due: 2032-11-30
fields:
  - {n: 1, name: model and version, status: given}
  - {n: 2, name: training energy and boundary, status: missing}
  - {n: 3, name: training emissions, both bases, status: missing}
  - {n: 4, name: hardware and training time, status: missing}
  - {n: 5, name: inference energy for a stated task, status: missing}
  - {n: 6, name: embodied emissions and amortisation, status: missing}
  - {n: 7, name: serving location, grid and water, status: partial, note: hosted in the EU; site not named}
  - {n: 8, name: evidence, status: missing, note: no vendor report supplied}
evidence_valid_for_months: 12
feeds: [supplier disclosure record, Chapter 8; tender annex TA-NR-ENV-01, Chapter 23]
Observable, expected, speculation
Observable. Some providers disclose training figures with a stated basis (Meta and Mistral AI); independent estimates exist for training and for hardware, with different boundaries; Annex XI, Section 1, point 2(e) of the AI Act requires providers of general-purpose AI models to document energy for authorities; the Model Documentation Form asks for training energy and inference compute, not inference energy; no delegated act under Article 53(5) was found adopted by November 2026; ITU-T L.1801 (02/2026) is in force as a voluntary guideline for the LCA of AI, and no ISO or CEN standard for it was found.
Expected. Model-level disclosure will remain partial for buyers while the energy rows of the form stay marked for authorities only; this follows from the form as published, not from a decided change. A European draft standard on the environmental impact of AI (prEN 18287) is expected to follow L.1801 once adopted; its date is not established.
Speculation. That a delegated act under Article 53(5) will fix a measurement method, that it will extend to inference energy, or that the training scale of the next generation of models will rise or fall, is not established by any source read for this chapter. The author's own projections are kept for Chapters 25 and 29.
Summary
The footprint of a model has four parts, training, fine-tuning, inference over its service life and the embodied impact of the hardware, and none is a single number. A training figure is accelerator hours, power, overhead and an emission factor, location-based or market-based, and the headline figure usually excludes experiments, idle energy, hardware manufacture and data preparation: in the BLOOM study the final run was 37 per cent of the project's dynamic energy and a fifth of its widest footprint. Embodied impact is known to a factor of two or three for assessed cards and not for servers. Whether training or inference dominates depends on volume, utilisation and the grid.
The allocation of the shared stages to a use is a decision, not a fact. Three rules, cut-off, per use and time window, move the per-use share by orders of magnitude for a model with many users; the record states the rule and its sensitivity. Life cycle assessment supplies the vocabulary (functional unit, boundary, cut-off, allocation, review), and ITU-T L.1801 applies it to AI, but a footprint record is an inventory, not an LCA, and no ISO or CEN standard for the LCA of AI was found. Providers disclose partly: the AI Act documents energy to authorities, not to buyers, and a buyer that wants the figures writes the eight-field sheet into the contract.
This chapter concerns E1 Measure. It gives the Count test its first artefact for the shared asset, the model footprint record, and it shows that a model-level figure is context and not the unit of decision. The unit of decision is the use, and Chapter 6 counts it: per query, per task and per agent run, with the multipliers of reasoning and context that the model figures here do not contain.
Sources
- European Parliament and Council of the European Union (2024). Regulation (EU) 2024/1689 laying down harmonised rules on artificial intelligence (Artificial Intelligence Act). Official Journal of the European Union, 12 July 2024; read in the consolidated version of 27 July 2026. (1, European Union, 2024)
- European Parliament and Council of the European Union (2026). Regulation (EU) 2026/1744 amending Regulations (EU) 2024/1689, (EU) 2018/1139 and (EU) 2023/1230 (Digital Omnibus on AI). Official Journal of the European Union, 24 July 2026. (2, European Union, 2026)
- European Commission (2025). The General-Purpose AI Code of Practice. European AI Office, 10 July 2025. (9, European Commission, 2025)
- Green Software Foundation (2024). Software Carbon Intensity (SCI) specification, adopted as ISO/IEC 21031:2024. (21, Green Software Foundation, 2024)
- Nordqvist, G. (2026). AI Platform and Security: Building and Securing AI Platforms in European Enterprises and Public Authorities. The Transformed Architecture, Book 3. (27, Nordqvist, 2026)
- Meta (2024). Llama 3.1 model card. GitHub, meta-llama/llama-models. Retrieved November 2026. (69, Meta, 2024)
- Luccioni, A. S., Viguier, S. and Ligozat, A.-L. (2022). Estimating the Carbon Footprint of BLOOM, a 176B Parameter Language Model. arXiv 2211.02001. Retrieved November 2026. (70, Luccioni et al., 2022)
- Elsworth, C. et al. (2025). Measuring the environmental impact of delivering AI at Google Scale. arXiv 2508.15734. Retrieved November 2026. (51, Elsworth et al., 2025)
- Oviedo, F. et al. (2026). Energy use of AI inference, efficiency pathways, and test-time scaling. Joule 10(8), 102430; preprint arXiv 2509.20241. Retrieved November 2026. (52, Oviedo et al., 2026)
- Mistral AI (2025). Our contribution to a global environmental standard for AI. Mistral AI, 22 July 2025. Retrieved November 2026. (45, Mistral AI, 2025)
- NVIDIA (2025). Product Carbon Footprint (PCF) Summary for NVIDIA HGX H100. Retrieved November 2026. (46, NVIDIA, n.d.)
- NVIDIA (2025). Product Carbon Footprint (PCF) Summary for NVIDIA HGX B200. Retrieved November 2026. (71, NVIDIA, 2025)
- Falk, S. et al. (2025). More than Carbon: Cradle-to-Grave environmental impacts of GenAI training on the Nvidia A100 GPU. arXiv 2509.00093. Retrieved November 2026. (72, Falk et al., 2025)
- Schneider, I. et al. (2025). Life-Cycle Emissions of AI Hardware: A Cradle-To-Grave Approach and Generational Trends. arXiv 2502.01671. Retrieved November 2026. (55, Schneider et al., 2025)
- GHG Protocol (2015). Scope 2 Guidance. World Resources Institute and World Business Council for Sustainable Development. Retrieved November 2026. (73, GHG Protocol, 2015)
- European Commission (2025). Model Documentation Form, Transparency chapter of the General-Purpose AI Code of Practice. Retrieved November 2026. (74, European Commission, 2025)
- International Organization for Standardization (2006). ISO 14040:2006 Environmental management. Life cycle assessment. Principles and framework. (22, ISO/IEC, 2006)
- International Organization for Standardization (2006). ISO 14044:2006 Environmental management. Life cycle assessment. Requirements and guidelines. (23, ISO/IEC, 2006)
- ITU (2026). Recommendation ITU-T L.1801 (02/2026), Guidelines for assessing the environmental impact of artificial intelligence systems. International Telecommunication Union. Retrieved November 2026. (78, ITU, 2026)
- Green Software Foundation (2026). Software Carbon Intensity for AI Specification. Retrieved November 2026. (75, Green Software Foundation, 2026)
- Dell Technologies (2025). Life Cycle Assessment of Dell Server PowerEdge R760. Vendor-published. Retrieved November 2026. (150, Dell Technologies, 2025)
- European Commission (2021). Commission Recommendation (EU) 2021/2279 on the use of the Environmental Footprint methods, Annexes 1 and 2. Retrieved November 2026. (161, European Commission, 2021)
- DIN (2026). Project page for prEN 18287:2026. Draft only; the text was not read. Retrieved November 2026. (162, DIN, 2026)
- CEN/CENELEC (2026). oSIST prEN 18287:2026, Artificial Intelligence: Requirements and guidance for the environmental impact evaluation of artificial intelligence systems and services, catalogue entry (retrieved November 2026; draft in public enquiry). (77, CEN/CENELEC, 2026)
- López-Rauhut, M. et al. (2026). Environmental Footprint of GenAI Research: Insights from the Moshi Foundation Model. arXiv 2604.11154; abstract page read. Retrieved November 2026. (163, López-Rauhut et al., 2026)