Water, Materials and Land: Beyond Carbon
Carbon is the footprint that most organisations already know how to count, and it is the only one that most AI disclosures cover. Water, materials and land are left out of nearly every figure in the public debate, and when they appear they appear with boundaries that differ so much that two honest numbers can be a hundred times apart. This chapter concerns E1 Measure and the Count test of the net-benefit principle (Chapter 4): how to count the water, the materials and the local effects of an AI use at a stated boundary and year, without false precision, and what to ask a supplier so that the count is possible. It does not argue that water is more important than carbon. It shows what the figures that exist actually measure, what is missing, and which questions a buyer can put in a contract.
The chapter builds on the platform view of AI Platform and Security, Chapter 22 (27, Nordqvist, 2026) and on the capacity and energy practice of AI Operations, Chapter 11 (34, Nordqvist, 2026). It does not repeat either. Chapters 5 and 6 count the energy of a model and of a use; this chapter counts what that energy, and the hardware behind it, draws from water, minerals and places.
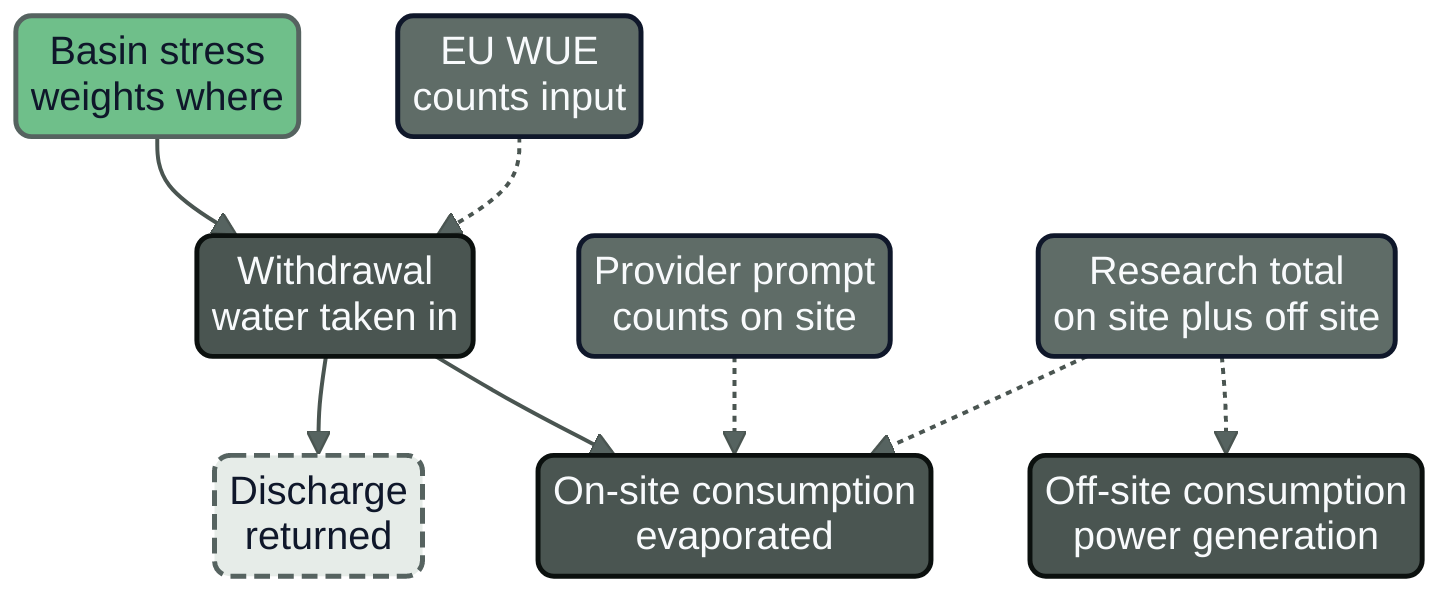
Figure 7.1: The water boundaries of an AI use. Each dotted line shows what a published figure counts. Basin stress is not a volume; it weights a volume by where it is taken.
A litre is not a litre
Four distinctions decide what a water figure means. Without them, a number is a sentence with the verb missing. Figure 7.1 maps them.
Withdrawal and consumption. Water withdrawal is freshwater taken from ground or surface sources, temporarily or permanently, for use. Water consumption is withdrawal minus discharge: the water that is evaporated, transpired, incorporated into products or otherwise removed from the immediate water environment. In the research literature on AI water footprints, withdrawal measures how much a sector competes for water and consumption the effect on downstream availability (54, Li et al., 2023). A cooling system that takes in a large volume and returns most of it to the river has a high withdrawal and a low consumption. A system that evaporates what it takes has the two close together.
Input. The reporting regime of the European Union uses a third word. The Commission defines water usage effectiveness (WUE) as the ratio of total water input to the energy consumption of the IT equipment (11, European Commission, 2026). It is an input measure, closer to withdrawal than to consumption, and it is expressed in cubic metres per megawatt-hour, which is the same as litres per kilowatt-hour. The same report, in a footnote on its sample, speaks of data centres with "total water consumption higher than 0", so the words are not held apart even in the source. This book quotes the definition sentence and never calls an EU WUE figure consumption.
On site and off site. Water is used where the servers are, mostly for cooling, and again where the electricity is generated, because thermal and some hydropower generation evaporate water. The research literature names these scope 1 (on site) and scope 2 (off site, the water of the electricity the data centre consumes), and adds scope 3, the water of the supply chain that makes servers and chips (54, Li et al., 2023). The three scopes are different quantities with different owners. The data-centre operator can meter the first, the electricity supplier and the grid determine the second, and the chip manufacturer holds the third. A figure that states only one of them is a partial figure, not a wrong one.
Where. A cubic metre taken from a stressed basin in August is not the same event as a cubic metre taken from a river in a wet region in March. The European Environment Agency reads the water exploitation index plus (WEI+), the share of renewable freshwater that is consumed (abstractions minus returns), as stress above 20 per cent and severe stress above 40 per cent (thresholds the EEA describes as commonly used and not formally agreed), and reports that water scarcity conditions affected 28 per cent of EU land area and 32 per cent of the EU population in 2023, a seasonal measure and lower in area than the 2000 to 2023 average (114, European Environment Agency, 2025). The Commission's own report says that WRI's Aqueduct atlas and the EEA's WEI+ give some assessment of stress but that an EU-wide basis for the local impact of data centres is still needed, as announced in the Water Resilience Strategy (11, European Commission, 2026). A volume, in other words, is not yet an impact. Section "Counting water for a use" shows how to carry the two apart in a record.
The four distinctions are summed up in a rule for this book: a water figure states whether it is withdrawal, input or consumption, which scopes it includes, the year, and whether the site or basin is stressed. The first three are in the sentence. The fourth is a column in the supplier record of Chapter 23.
What providers and researchers report
Two sources dominate the public numbers, and they measure different things. Table 7.1 sets them side by side with their boundaries.
Table 7.1: Published water figures for AI and for data centres, each with its boundary. Retrieved November 2026. The rows are not comparable and must not share an axis.
| Figure and value | Boundary | Year and source | Kind |
|---|---|---|---|
| Gemini Apps median text prompt, water: 0.26 mL | Energy per prompt times fleet 2024 WUE; serving only; not indicative of every prompt | Data of May 2025; Google (43, Google, 2026) | Vendor-reported |
| Google data centres and offices: 10.9 billion US gallons (41 million m3) consumed, up 34% on 2024 | Consumption, whole company | 2025; same | Vendor-reported |
| Google replenishment projects: about 7.7 billion gallons, about 78% of consumption | Company-estimated volume restored | 2025; same | Vendor-reported |
| GPT-3-class medium response, United States average: 16.9 mL (2.2 on site, 14.7 off site) | Consumption, scopes 1 and 2, location-based; 0.004 kWh server energy per request assumed | Model of 2023, v5 of March 2025; Li et al. (54, Li et al., 2023) | Independent estimate |
| Same, Ireland, Netherlands, Sweden: 7.1, 15.9 and 28.3 mL (off site 7.0, 15.7, 27.9) | As above | As above | Independent estimate |
| EU data centres, mean reported WUE: 0.58 m3/MWh, energy-weighted; national means 0.07 to 1.28 | Water input per IT energy; centres reporting above zero; 458 with reliable values | May to September 2024; COM(2026) 500 (11, European Commission, 2026) | Operator-reported to authorities |
Four readings follow from the table.
First, Google's 0.26 mL and the research estimate of tens of millilitres do not contradict each other. One is a median text prompt of a recent, efficiency-optimised serving fleet, estimated from energy per prompt and the fleet-wide WUE; the other is a medium conversation of a model generation that was older when the paper was first written, counted with the off-site water of the electricity, using an energy assumption the authors call conservative. The Sweden row is the instructive one. Its on-site figure is 0.36 mL and its off-site figure 27.9 mL, so the total is driven almost entirely by the water factor of the electricity, which depends on how the method treats hydropower. The ranking of countries in the paper is a ranking of electricity-water factors, not of data-centre cooling, and the paper says its results depend on location and on time. By the book's arithmetic from the table, the Sweden row implies about 7 litres of water per kilowatt-hour of server energy (27.9 mL divided by 0.004 kWh); that is an implied factor of the paper's method, not a measurement of Swedish hydropower.
Second, the company-level figure is a consumption total, and it grew by 34 per cent in a year in which the company also reports far lower per-prompt energy and emissions. Both statements are true at their boundaries. A falling cost per unit and a rising total are the pattern that Chapter 10 treats under rebound. The same report says that its water-cooled sites in The Dalles needed 6 to 10 per cent additional energy for overhead in the fourth quarter of 2025 against a stated industry average of 54 per cent, and consumed 469 million gallons there in 2025, and presents the water as a means of saving electricity (43, Google, 2026). That is a trade-off between two resources that the cooling design settles, and it is reported by the party that made the design. It is evidence of a trade-off, not independent evidence of its size.
Third, the replenishment figure is a different kind of number. It counts the volume that projects are estimated to restore, with the company's own method, against the consumption. It does not reduce the consumption and it is not a balance in the basin where the water was taken. This book treats replenishment as a claim to be written into a claim record (Chapter 22) with its boundary, and never as a subtraction from a footprint (the net-benefit principle of Chapter 4: an unproven benefit does not offset a measured footprint, and neither side pays for the other).
Fourth, nothing in the table is a figure for a European enterprise's own use. No European hyperscaler or provider figure per request with a water boundary was found in the evidence read for this chapter, and none of the 2026 per-prompt disclosures of other providers could be verified. That absence is itself a finding, and it is why Section "What to ask a supplier" exists.
Observable: company water totals are rising at the provider that reports them, per-prompt energy and emissions figures are falling at the same provider, and the figures in circulation differ by two orders of magnitude because their boundaries differ (43, Google, 2026) (54, Li et al., 2023). Expected: more providers will publish a water figure per unit of service as facility-level reporting under the EU data-centre scheme matures, but the boundaries will differ until a common method is required. Speculation: that a single per-prompt water number will become comparable across providers without a standard.
What regulators and the Commission report
Since 2024, the owners and operators of data centres in the Union with an installed IT power of at least 500 kW must make public the information of Annex VII of Directive (EU) 2023/1791 each year, and the Commission keeps a European database of it, publicly available at aggregated level (Article 12(1) and (3)) (5, European Union, 2023). Article 12(5) required the Commission to assess the data and report, with legislative proposals where appropriate, including minimum performance standards. The report that answers it is COM(2026) 500 final of 21 September 2026 (11, European Commission, 2026). What it says about water, and what it cannot say, is the best available European baseline.
It reports data from 770 data centres in the first reporting period (May to September 2024), around 36 per cent of the estimated population that falls under the requirement; six Member States reported none and five fewer than three, and 70.1 per cent of the reported data were deemed reliable. The energy-weighted average WUE was 0.58 m3/MWh. The report explains the national spread of 0.07 to 1.28 by climate and cooling technology, and adds that in some Member States the figure is dominated by a few large single-site operators. Most data centres missed the 0.4 m3/MWh WUE target of the Climate Neutral Data Centre Pact, an industry initiative whose target year the report gives as 2040. Three cautions apply before anyone quotes the 0.58.
- It is an average of a self-selected, partly reliable sample of 36 per cent of the population, and the sample size of the WUE analysis differs by figure in the report itself (458 centres in one, 584 in another).
- Only data centres that reported a water value above zero were included, so dry-cooled sites are excluded and the mean is biased upwards. A site that cools with air and buys more electricity has a low WUE and a high off-site water bill, and the metric does not see the difference.
- It is input per unit of IT energy, so it says nothing about consumption, about the electricity, or about the basin.
The report presents minimum performance standards for PUE, WUE and the renewable energy factor as an option "tailored" to size, age, climate and location, and says that a future reporting scheme could replace "potable water input" by "freshwater input" and could add local water availability. It also finds that only 15 per cent of the centres that reported a refrigerant declared one with a global warming potential below 150, and that only 67 centres reported any waste-heat reuse, about 1.8 per cent of the heat generated (all first reporting period, 2024). The Commission reports that a common rating scheme for data centres has been adopted as a delegated act; as of November 2026 it is adopted by the Commission and not yet in force, and the first phase remains Delegated Regulation (EU) 2024/1364 (6, European Commission, 2024). The European Water Resilience Strategy of June 2025 says that the Commission will rate the energy efficiency and overall sustainability of data centres and "propose minimum performance standards, including for water consumption", and lists the inclusion of water usage in the common rating scheme as an action (14, European Commission, 2025). It is a commitment to propose, not a rule.
Observable: the reporting regime exists, has a database and has produced a first analysis with the limits above. Expected: a rating scheme that includes water, and a proposal on minimum performance standards that the Commission has said it will bring forward. Speculation: that water caps become binding in permitting across Member States.
Materials and e-waste
The water of the chip is a different supply chain from the water of the cooling tower, and so are the minerals. This section covers the part of the footprint that sits in the hardware.
Embodied emissions are the measured part. The materials footprint is, in the published record, counted in carbon, not in tonnes of minerals. Table 7.2 gives two sets of figures, both from manufacturers (Chapter 5 reads the same hardware figures for the footprint of a model).
Table 7.2: Published embodied-emission figures for AI hardware. Retrieved November 2026. The first is a baseboard, the second a chip; they must not be compared or divided.
| Item and value | Boundary | Year and source | Kind |
|---|---|---|---|
| NVIDIA HGX H100 baseboard: 1,312 kg CO2e; materials and components 91%; memory 42%, integrated circuits 25%, thermal 18% | Cradle to gate, baseboard only; excludes host, networking, build, use, end of life | Summary of 2025 (46, NVIDIA, n.d.) | Vendor-reported, third-party reviewed (ISO 14067) |
| Google TPU per chip, manufacturing and transport: 208, 238, 323, 366, 585 kg CO2e (v4i, v5e, v6e, v4, v5p) | Per chip; host and construction separate; whole-computer inventory cradle to grave | Preprint, February 2025 (55, Schneider et al., 2025) | Vendor-authored preprint |
The baseboard figure is not a per-GPU figure, and dividing it by eight gives an arithmetic quotient, not a vendor statement. The Google study reports, over a six-year life, that operational emissions are about 70 per cent of the total with market-based accounting and about 90 per cent with location-based accounting, with embodied emissions under 25 per cent from manufacturing and under 5 per cent from data-centre construction in the market-based case (55, Schneider et al., 2025). The share of embodied emissions therefore depends on the electricity: on a clean grid it rises. This is the case for the Nordic worked example below, and it is the reason Chapter 16 asks for an embodied figure for every allocated server and not a rule of thumb.
Minerals are not measured per use. No source read for this chapter gives tonnes of critical or strategic raw materials per accelerator, per server or per use, and none gives the water or energy of chip fabrication with a European boundary that could be verified. The Critical Raw Materials Act sets supply benchmarks for 2030 for strategic raw materials as a whole: extraction capacity of at least 10 per cent, processing capacity of at least 40 per cent and recycling capacity of at least 25 per cent of annual Union consumption, and no more than 65 per cent of annual consumption from a single third country at any stage (Article 5) (12, European Union, 2024). It is a materials-supply regulation and does not mention data centres. The link to servers and chips is this book's inference: AI hardware is one use of a supply that the regulation treats as strategic, and a buyer that asks for recycled-content and take-back information is asking for the data the benchmarks will need. Nothing more is claimed.
Fabrication. The chip-making stage consumes electricity and ultra-pure water at scale. The Water Resilience Strategy says that semiconductors and data centres "consume large volumes of often ultra-pure water" (14, European Commission, 2025). A European buyer cannot count scope 3 water for a model today, and the record says so (Chapter 8).
E-waste. The Global E-waste Monitor 2024, by UNITAR and ITU, reports 62 million tonnes of electronic waste generated worldwide in 2022, a projection of 82 million tonnes in 2030, 22.3 per cent of the 2022 mass documented as formally collected and recycled, and US$ 62 billion of recoverable natural resources unaccounted for (115, UNITAR and ITU, 2024). The 2024 edition is the latest the author could find; no 2026 edition was located, and figures attributed to one in circulation could not be traced to a source. The data are global, cover all electrical and electronic equipment and do not separate servers or AI hardware. For Europe, no statistic of server e-waste with a verified source was found. The honest statement is that the e-waste of AI hardware is not measured separately in any source this book can cite.
How long hardware lasts is an accounting estimate. The embodied cost per year of service depends on how long the hardware stays in service. The filings of large providers give the depreciation lives they assume, and these are accounting estimates, not measurements of physical life. Amazon reports that from 1 January 2025 it shortened the life of a subset of servers and networking equipment from six to five years "due to the increased pace of technology development, particularly in the area of artificial intelligence and machine learning" (121, Amazon, 2026). The same filing records the move before it: effective 1 January 2024 Amazon lengthened the life of its servers from five to six years (121, Amazon, 2026). It is a fiscal year 2025 filing, read in November 2026, and the two changes of one company point in opposite directions. A buyer cannot infer the embodied cost per year from either; it can ask the supplier for the life assumed in the allocation and the date of the assumption, which is a field of the supplier record below and the subject of Chapter 16.
Observable: embodied figures are published by two manufacturers, global e-waste rose to 62 million tonnes in 2022, and one large provider has changed its depreciation life for servers in both directions. Expected: more product carbon footprints for AI hardware as buyers ask for them. Speculation: that a mineral footprint per AI use becomes measurable in the next procurement cycle.
Land and local effects
A data centre is a building connected to a grid, a water supply and a neighbourhood. What it does there is reported by operators, by authorities and by residents, and the three do not use the same words. This section keeps to what has a source and says who reported it.
Heat. The recast Energy Efficiency Directive requires Member States to ensure that data centres with a total rated energy input above 1 MW use the waste heat or other waste-heat recovery applications unless they can show that it is not technically or economically feasible, following a cost-benefit assessment (Article 26(6)) (5, European Union, 2023). The Commission's report found reuse reported by 67 data centres and about 1.8 per cent of the heat generated, in the first reporting period (11, European Commission, 2026). Heat is therefore a local effect that is in law a feasibility test and in the data a rare practice.
Backup generation and air quality. Backup generators are diesel engines that run in tests and in outages. The Medium Combustion Plant Directive lets Member States exempt existing plants that run no more than 500 hours a year, as a rolling average over five years, and new plants no more than 500 hours a year, as a rolling average over three years, from the emission limit values in the directive's annex (13, European Union, 2015). The exemption relieves the plant of the limit values; it is not a cap on running, and national transposition differs. The operator of a data centre in a given Member State must therefore read its permit, which states the hours and the limits that apply.
Refrigerants. Cooling plant uses fluids that have a global warming potential. The Commission's report found that 15 per cent of the data centres that reported their refrigerant declared one with a global warming potential below 150 (11, European Commission, 2026). It is a first-period figure on a self-selected sample, and it is an opening for the cooling question in Chapter 18, not an account of the sector.
Grid and land. The effects that residents and authorities raise most often are the connection to the grid, the use of land and the noise of cooling plant. This book found no primary source on noise or on land use with a European boundary and does not state a figure for either. Chapter 18 treats the grid connection and the Swedish queue for connection.
Local conflicts, by who reported them
Two kinds of statement are kept apart: what happened, as reported, and what a party claims.
In Aragon, Spain, Reuters reported on 6 October 2026 that the regional government granted fast-track status to a large data-centre development by Amazon, that the company plans to invest EUR 33.7 billion in the region, and that at the end of 2024 the public had 23 days to review about 25,000 pages of project documents. Reuters also reported that the environmental group Ecologistas en Acción has brought a legal challenge to the fast-track approval, described as what is believed to be Spain's first lawsuit targeting a major data-centre development, and that Spain's central government has drafted stricter water and electricity rules for data centres, which industry and Aragon's authorities criticise, with a snap election on 29 November adding uncertainty (123, Lombardi & Pons, 2026). The article gives no water volumes. What can be stated is the shape of the dispute: a permitting route that shortens approval, a public that says it had too little time, a regional authority and a company that say the investment is beneficial, and a national draft that touches water and electricity. The source is a wire copy read through a news aggregator, a secondary source for a case that has not been decided.
Unverified, not used. Reports of cooling failures at London data centres in the summer 2026 heatwave could not be traced to an operator's or authority's primary statement; the one well-documented incident found is from July 2022. This book therefore states no 2026 cooling failure as fact. Chapters 17 and 18 meet the gap again.
Observable: contested permitting, a lawsuit, a national draft on water and electricity in one Member State, reported by Reuters. Expected: more authorities will ask for water and heat information at permitting. Speculation: that water becomes the binding constraint on data-centre siting in Europe at scale.
Counting water for a use
An organisation that wants the water of a use writes a record for it, not a number. The calculation is simple; the discipline is in the ranges and the labels. Let E be the IT energy per functional unit at a stated boundary. The consumption of water per unit is then the sum of three terms at their boundaries: the on-site input, converted to a consumed share; the off-site consumption of the electricity, taken at the facility energy (IT energy times the power usage effectiveness, PUE, the ratio of whole-facility energy to IT energy); and, where a source exists, the supply-chain term. This chapter fixes the first two and leaves the third blank on purpose, because no source supports a number for it.
The worked example counts the same assistant in two regions. It uses the citizen-service assistant of Nordvik Region, FPR-NR-0001, whose October 2026 Software Carbon Intensity calculation used 1,970 kWh for GPU servers and host over 71,000 resolved enquiries (Chapter 8 and AI Platform and Security, Chapter 22) (the specification is ISO/IEC 21031:2024) (21, Green Software Foundation, 2024). That is 0.0277 kWh per resolved enquiry; the profile does not say whether it includes the overhead of the facility, so the example treats it as IT energy. (Chapter 6 gives its own estimate for September 2032 at another boundary; this example keeps the 2026 figure because its source is public.) Every factor below is an illustrative placeholder for the shape of the calculation, labelled so, and none is a measurement of any real site. The ranges for the water of the electricity are deliberately wide, because the published implied factors differ by a method choice, as the Sweden row of Table 7.1 shows.
"""Water per resolved enquiry at two boundaries (illustrative factors)."""
E_IT = 1970 / 71000  # kWh of IT energy per resolved enquiry (Oct 2026 profile)

SITES = {  # name: (pue, input L/kWh IT, consumed share of input, off-site L/kWh)
    "Nordic hosting region": (1.15, (0.05, 0.30), (0.2, 0.9), (0.3, 6.0)),
    "Continental region":    (1.38, (0.40, 1.00), (0.5, 0.9), (0.5, 4.0)),
}

def water_ml(pue, wue_in, share, ewif, i):
    """i = 0 for the low end of every range, 1 for the high end."""
    on_input = E_IT * wue_in[i] * 1000          # on-site, input (withdrawal-type)
    on_cons = on_input * share[i]               # on-site, consumed
    off_cons = E_IT * pue * ewif[i] * 1000      # off-site, consumed
    return on_input, on_cons, off_cons, on_cons + off_cons

for name, p in SITES.items():
    lo, hi = water_ml(*p, 0), water_ml(*p, 1)
    print(f"{name}: on-site input {lo[0]:.1f}-{hi[0]:.1f} mL; "
          f"on-site consumed {lo[1]:.1f}-{hi[1]:.1f} mL; "
          f"total consumed {lo[3]:.1f}-{hi[3]:.1f} mL per enquiry")
Run on 3.12, the script prints the figures of Table 7.3, to the rounding shown (the low total of the Nordic region is 9.85 mL, which the script prints as 9.8).
Table 7.3: The same assistant counted for on-site and total water in two regions (illustrative). Consumption per resolved enquiry, scopes 1 and 2, supply chain excluded; IT energy of October 2026; low and high ends of placeholder ranges. Not data.
| Region (illustrative) | On-site input, mL per enquiry | On-site consumed, mL | Off-site consumed, mL | Total consumed, mL |
|---|---|---|---|---|
| Nordic hosting region | 1.4 to 8.3 | 0.3 to 7.5 | 9.6 to 191 | 9.9 to 199 |
| Continental region | 11 to 28 | 5.6 to 25 | 19 to 153 | 25 to 178 |
At 146,000 enquiries a month the total is about 1,400 to 29,000 litres in the Nordic region and about 3,600 to 26,000 litres in the continental region. The table teaches four things, none of which depends on the placeholders.
- The on-site ranking is clear and the total is not. On site, the continental region needs several times the water of the Nordic one, which agrees with the Commission's observation that cooler regions need less water cooling (11, European Commission, 2026). In total, the ranges overlap almost completely, because the off-site term can dominate and is uncertain by more than an order of magnitude. A statement that the Nordic region is better for water is supportable for the data centre and unsupported for the whole use until the electricity-water factor is stated and sourced.
- Input is not consumption. The first two columns differ by the consumed share, which only the operator knows. An EU-style site figure of input per IT kWh is an upper bound on on-site consumption, not a value for it.
- The count is small per unit and not small in total. Roughly ten to two hundred millilitres per enquiry in these ranges, at 146,000 enquiries a month, is some thousand to some tens of thousands of litres a month. Whether that is large depends on the basin, which is why the record carries a stress field and not only a volume.
- Basin stress is a separate column, filled from a source. The stress of the basin where the on-site water is taken is read from an index such as WEI+, with the year, and stored with the volume. Two records with the same volume and different stress are different findings.
Practical guide: counting the water of a use
Purpose: put a water figure with a boundary, a range and an evidence age into the footprint record of a use (FPR-*, Chapter 6), so that it can be compared with itself next year.
Roles: sustainability lead, procurement officer, data-centre or energy manager, platform engineer, AI product owner.
Inputs: the IT energy per functional unit from the footprint record; the supplier's disclosure record for the site (below); the PUE of the site; a published or supplier-provided water factor of the electricity, with its method; the stress index of the site's basin.
Steps:
- State the functional unit and the boundary (consumption or withdrawal, scopes 1 and 2, supply chain excluded or included with a source).
- Get the site's water input per IT kWh and the consumed share from the supplier; if only a site total exists, say so, and use the range, not a point.
- Choose the electricity-water factor with its method (whether reservoir evaporation is counted) and record the choice; if two methods are plausible, run both.
- Compute the low and the high end, as in the script, and write both.
- Read the basin stress for the site and year and write it beside the volume.
- Record the date and the expiry. A measured footprint of a running use is valid for 90 days (illustrative); a supplier disclosure for 12 months.
Artefact: the water block of the footprint record.
# Water block of FPR-NR-0001 (illustrative figures, not data)
fpr: FPR-NR-0001
water:
  boundary: consumption; scopes 1 and 2; supply chain not counted
  unit: resolved enquiry
  year: 2032
  it_energy_kwh_per_unit: 0.0277      # October 2026 profile, treated as IT energy
  site: eu-north-1 (hosting provider, NR-2026-031)
  on_site:
    input_l_per_kwh_it: {low: 0.05, high: 0.30, source: SDR-NR-0001}
    consumed_share: {low: 0.2, high: 0.9, source: SDR-NR-0001}
  off_site:
    factor_l_per_kwh: {low: 0.3, high: 6.0}
    method: both methods run; reservoir evaporation counted in the high case
  result_ml_per_unit: {low: 9.9, high: 199}
  basin_stress: {index: WEI+, value: not yet sourced, year: null}
  status: placeholder factors; replace when SDR-NR-0001 is answered
  measured_on: 2032-10-05
  valid_until: 2033-01-03             # 90 days
  reviewed_by: sustainability-lead
The record states that it is a placeholder and that the basin stress is not yet sourced. A record that says what it does not know is a better record than a figure that does not.
What to ask a supplier
A buyer that cannot count the water of a use can ask the party that can. Directive (EU) 2023/1791 gives operators of 500 kW or more a public reporting duty (5, European Union, 2023), and the Annex VII figures include total water input as a site figure; the Nordvik Region has them for reporting year 2031 as a site total only, not by customer or workload. A deployer has no direct environmental duty under the AI Act, so the request is a contract term (Chapter 21, Chapter 23). The supplier disclosure record SDR-* carries the answers; it is introduced here for water and materials, extended in Chapter 8 for energy and carbon and completed as a tender form in Chapter 23.
sdr: SDR-NR-0001
supplier: European hosting provider (contract NR-2026-031)
requested_by: procurement-manager
date: 2032-10-05                      # date of this request for the water, materials and local fields
annex_vii_received_on: 2032-05-15     # site-level figures of reporting year 2031, see Chapter 8
valid_until: 2033-05-15               # 12 months from receipt of the Annex VII figures; answers to this request carry their own date
water:
  reporting_year: 2031
  site_total_input_m3: null           # asked, not yet received
  wue_input_l_per_kwh_it: null
  wue_definition: "total water input per IT energy"   # EN 50600 family, as in COM(2026) 500
  cooling_technology: null            # dry, adiabatic assist, evaporative
  water_source: null                  # potable, reclaimed, surface, ground
  consumed_share_of_input: null
  basin_and_stress_index: null
  allocation_to_customer: null        # by energy, by reserved capacity, none
  replenishment_claim: {volume_m3: null, method: null, independent_check: null}
materials:
  embodied_carbon_per_server_kg_co2e: null   # with boundary, as in a product carbon footprint
  assumed_service_life_years: null
  assumption_date: null
  take_back_and_reuse: null
  e_waste_route: null
  recycled_content_share: null
local:
  backup_generation: {hours_per_year_permit: null, hours_per_year_actual: null}
  refrigerant_gwp: null
  waste_heat_reuse: null
status: draft; fields marked null are the questions
Three points on using it. First, ask for the definition with each figure; a value with no definition is not a disclosure. Second, ask for the allocation rule, because a site total divided across customers by an unstated rule is not a footprint of your use. Third, record a refusal as a finding. A supplier that answers "not available" has told the buyer something about the confidence it can place in any claim, and the record keeps the date.
Limits of the evidence
The limits are part of the method. This chapter could not find or verify:
- a European per-request water figure from any provider, or any 2026 per-prompt disclosure by a provider other than Google;
- the text of the common rating scheme for data centres and the classes it sets for water; the legal text of any proposal on minimum water standards;
- any basin-level data on data-centre water in a European member state, or an Aragon licence volume;
- tonnes of critical raw materials per accelerator, the water and energy of chip fabrication with a European boundary, and statistics of server e-waste in the Union;
- a primary source on noise, on land use, or on the extent of diesel running in the European Union;
- any 2026 heatwave cooling failure with an operator's or authority's statement.
Each is a gap that a regulator, a provider or a researcher could close, and a buyer can ask.
Across the modes and the organisations
Across the usage modes
At the level of a buyer, water and materials differ little by usage mode; they differ by where the capacity is hosted and who can meter it. Table 7.4 maps the mode to the party that can count.
Table 7.4: Who can count water and materials, by usage mode.
| Usage mode | Who can count water and materials | What the buyer can obtain | Note |
|---|---|---|---|
| Mode 0 Ambient AI | The software supplier | Nothing by default; supplier notice and a contract clause | A supplier-reported row in the register |
| Mode 1 Conversational assistants | The provider | Provider figures with their boundary, if published | Compare no figure across providers |
| Mode 2 Embedded workplace assistants | The supplier of the suite | Tenant-level report if offered | Same |
| Mode 3 Agentic work tools | Provider and platform team | Per-run energy from the gateway, site water from the host | Agent runs multiply the energy term (Chapter 6) |
| Mode 4 Built AI applications | The platform team and the host | The full block above | The mode where the buyer can count most |
| Mode 5 Autonomous production agents | The platform team and the host | As Mode 4, per completed task | Level 4 is never used to publish a water claim or to disable the meter or the budget |
Nordvik Region and Hansa Mutual
The figures of both organisations are illustrative and labelled so.
Nordvik Region hosts in a cool climate and, for its own nordvik-dc, runs at about 640 kW of installed IT power and a power usage effectiveness of about 1.55, with no waste-heat reuse at baseline and the AI share of the data centre unmetered (illustrative). The Region has Annex VII figures for its hosting provider for reporting year 2031 with total water input only as a site figure. In this chapter, the Region writes the water block above for FPR-NR-0001 with placeholder factors and sends SDR-NR-0001 to the provider, and its procurement manager, Ida Pettersson, adds the water and materials fields to the tender annex TA-NR-ENV-01. When residents ask the municipality about a regional data-centre plan, the Region's property and energy manager, Mats Öberg, answers with metered facts about nordvik-dc (power, cooling, heat), not with the unmetered AI figures; a public statement says what was counted and at which boundary, and no more. Because the Region is a public authority, its records are open to requests under Swedish public-access rules, which is why every block states its own limits.
Hansa Mutual runs the Frankfurt data centre at about 2.8 MW of installed IT power and a PUE of about 1.38, cooled by chillers with adiabatic assist, with total water input reported at site level only and not allocated to uses; Cloud A (Ireland, as a placeholder) and Cloud B (France, as a placeholder) report market-based carbon figures with a lag and no water by customer. Its Scope 3 figure carries no water. Dr. Verena Lindner owns the method for counting AI inside Scope 2 and Scope 3 and adds water as a stated gap with a plan: a continental-region count for FPR-HM-0001 in the form of Table 7.3 and a request to Katja Neumann, manager of the data centre, for the consumed share and the cooling split. The group's stress reading for Frankfurt is read from a published index with its year, and it is not assumed. The group asks its two cloud suppliers the questions of the supplier record and records the answers, or the refusals, with their dates. Neither organisation is asked to claim that its water is low. Each is asked to say what it counted.
Summary
Water, materials and land are the part of the footprint that carbon leaves out, and the part where figures with different boundaries are most often compared. This chapter concerned E1 Measure and the Count test. A litre needs four statements before it is a figure: withdrawal, input or consumption; on site, off site or supply chain; the year; and the stress of the basin. The European reporting regime defines WUE as total water input per IT energy, and its first analysis of 770 data centres gives 0.58 m3/MWh for 2024 on a partial and biased sample; it is not a consumption figure and not a figure for a use. Provider per-prompt figures at the data-centre boundary and research estimates with off-site water differ by two orders of magnitude, and both are honest at their own boundary.
Materials are counted in carbon, not in minerals, in manufacturer figures that cover a baseboard or a chip and not a use. E-waste is measured globally, with the 2024 Global E-waste Monitor as the latest edition, and not for AI hardware. Local effects (heat, backup generation, refrigerants, grid, land, noise) are governed by feasibility tests, permit hours and local permitting, and the conflicts that have been reported are described here by who reported them, with the unverified heatwave reports set aside. The chapter's own conclusion is that a buyer can count water and materials for a use only to the extent that the supplier answers a short list of questions with definitions, and that a range with its limits is a better figure than a point.
A reader can act on this at once: write the water block of the footprint record of one use with a range and an evidence age, and send the supplier record to the host of that use. Chapter 8 turns these records into practice, with telemetry, tags, standards and supplier figures, and treats evidence age.
Sources
- European Parliament and Council of the European Union. Directive (EU) 2023/1791 of 13 September 2023 on energy efficiency (recast). Articles 12 and 26. (5, European Union, 2023)
- European Commission. Commission Delegated Regulation (EU) 2024/1364 of 14 March 2024 on the first phase of the establishment of a common Union rating scheme for data centres. (6, European Commission, 2024)
- Green Software Foundation. Software Carbon Intensity (SCI) specification, ISO/IEC 21031:2024. (21, Green Software Foundation, 2024)
- Li, P., Yang, J., Islam, M. A. and Ren, S. Making AI Less "Thirsty": Uncovering and Addressing the Secret Water Footprint of AI Models. arXiv:2304.03271v5, 26 March 2025, accepted by Communications of the ACM. Retrieved November 2026. (54, Li et al., 2023)
- European Commission. Report on the energy efficiency of data centres in the EU, COM(2026) 500 final, 21 September 2026. Retrieved November 2026. (11, European Commission, 2026)
- Google. 2026 Environmental Report. Vendor-reported. Retrieved November 2026. (43, Google, 2026)
- European Environment Agency. Use of freshwater resources in Europe, indicator page, 28 November 2025. Retrieved November 2026. (114, European Environment Agency, 2025)
- European Parliament and Council of the European Union. Regulation (EU) 2024/1252 establishing a framework for ensuring a secure and sustainable supply of critical raw materials (Critical Raw Materials Act). Article 5. Retrieved November 2026. (12, European Union, 2024)
- European Parliament and Council of the European Union. Directive (EU) 2015/2193 on the limitation of emissions of certain pollutants into the air from medium combustion plants. Article 6. Retrieved November 2026. (13, European Union, 2015)
- European Commission. European Water Resilience Strategy, COM(2025) 280 final, 4 June 2025. Retrieved November 2026. (14, European Commission, 2025)
- UNITAR and ITU. The Global E-waste Monitor 2024. Retrieved November 2026 from the programme page; the report PDF was not read. (115, UNITAR and ITU, 2024)
- NVIDIA. PCF Summary for NVIDIA HGX H100. Vendor-reported, third-party reviewed. Retrieved November 2026. (46, NVIDIA, n.d.)
- Schneider, I., Xu, H., Benecke, S., Patterson, D., Huang, K., Ranganathan, P. and Elsworth, C. Life-Cycle Emissions of AI Hardware: A Cradle-To-Grave Approach and Generational Trends. arXiv:2502.01671, 1 February 2025. Vendor-authored preprint. Retrieved November 2026. (55, Schneider et al., 2025)
- Amazon.com, Inc. Form 10-K for the fiscal year 2025. Retrieved November 2026. (121, Amazon, 2026)
- Lombardi, P. and Pons, C. "Fast-track permits turn Spain's Aragon into a $70 billion data centre magnet. At what cost?" Reuters, 6 October 2026, wire copy read through a news aggregator. Retrieved November 2026. (123, Lombardi & Pons, 2026)
- Nordqvist, G. AI Platform and Security, Chapter 22, and AI Operations, Chapter 11, The Transformed Architecture, Books 3 and 10. (27, Nordqvist, 2026) (34, Nordqvist, 2026)