Hardware and Lifecycle: Utilisation, Embodied Impact, Reuse and Retirement
Chapters 12 to 15 worked down the optimisation hierarchy: do not run what is not needed, use the smallest adequate model, serve it efficiently, bound agents by a budget. This chapter takes the fifth and last level, hardware and lifecycle, and it concerns E3 Design, the function of choosing and shaping the solution for less. The budget that applies here is an energy ceiling for a pool of hardware, measured at the rack or on the invoice and not by any agent, and the stop path is a power-down or a release that a named person holds (Chapter 4). The level is about the machine under the workload: how fully it is used, what it cost the environment to make, how long it stays in useful work, and where it goes afterwards. It comes last because it is the slowest lever, decided by a purchase cycle and not by an environmental argument.
Most enterprises and public authorities buy capacity and do not own accelerators, but a contract can still say who pays for idle hours, who knows the age of the machines and what happens to them at the end. The chapter treats the owner of a GPU cluster (Hansa Mutual) and the buyer of reserved capacity (Nordvik Region) side by side, and introduces the hardware lifecycle record, HWL, that both keep.
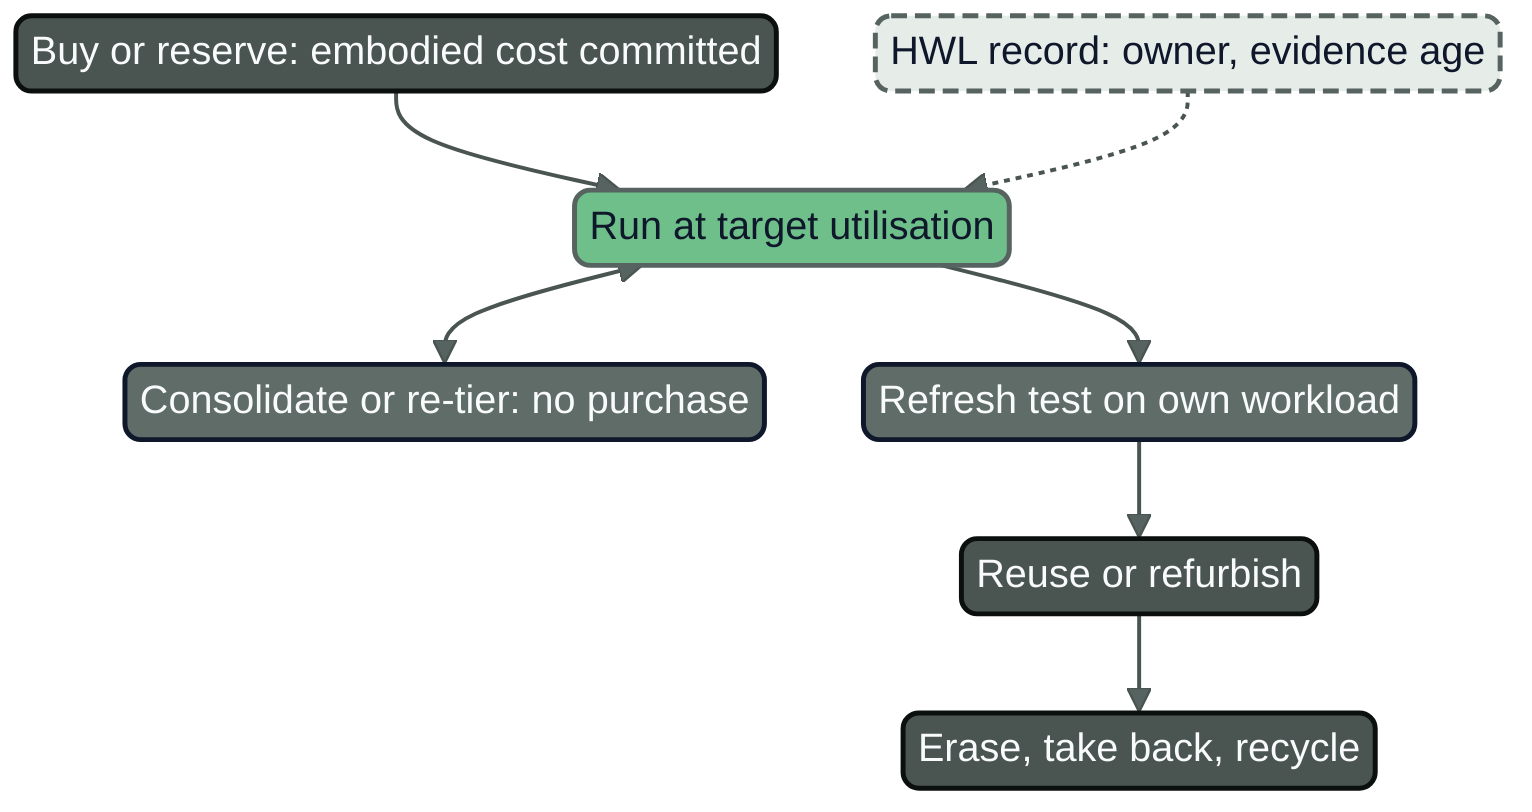
Figure 16.1: The hardware lifecycle as a loop with a refresh test. Consolidation and re-tiering come before purchase; the HWL record carries the owner, the figures with their boundary and the evidence age.
A rack at the end of its contract
A cluster of twelve eight-accelerator servers has run for three and a half years. The vendor has announced a newer generation, the finance calendar has a refresh slot, and the utilisation of the cluster, measured at the rack, is 0.52. Nobody has asked what keeping, consolidating or replacing the cluster would cost the environment, or what happens to the old machines if the order goes ahead. This is Hansa Mutual's situation (illustrative); the worked example below shows the decision when the questions are asked in the right order.
The order matters. Utilisation comes first, because it costs nothing and changes the footprint of every unit of work. Embodied impact comes second, because it tells how much a purchase must save. Reuse and retirement come last, because they decide whether embodied impact already spent produces more work.
Embodied impact: what is known, and how thin it is
Embodied impact is the greenhouse gas emitted, and the resources used, to make a piece of hardware: mining and refining of materials, manufacture of chips and memory, assembly and transport. It is counted once, at manufacture, and spread over the working life of the hardware. Chapter 5 explained the kinds of evidence and Chapter 7 tabulated the published figures with their boundaries; this chapter uses them. Three points govern lifecycle decisions.
First, most of the published embodied figures are vendor-reported and cover part of a system. The NVIDIA product carbon footprint for an HGX H100 eight-accelerator baseboard is a cradle-to-gate figure, from raw material extraction to the factory gate, commissioned by the vendor and reviewed to ISO 14067. It excludes the host server, networking, the data-centre build, use and end of life, and it attributes 91 per cent of the baseboard's emissions to materials and components, with high-bandwidth memory the largest single item (46, NVIDIA, n.d.). It is the figure Chapter 7 relies on; it is not per accelerator, and it is a floor for an AI server, not a total.
Second, the one complete server study found in the research for this book is for a general-purpose server, not an AI server. Dell's life cycle assessment of the PowerEdge R760, a two-socket server, assumes a four-year life and finds a global warming potential of 4,177.4 kg CO2e under a United States electricity scenario and 2,896.0 kg under a European one, with the use phase contributing about 87 to 91 per cent and manufacturing about 10 to 15 per cent; end-of-life recycling earns a credit of 62.2 kg. Its use-phase energy for a light-to-medium workload is about 7,893 kWh over the four years (150, Dell Technologies, 2025). The report was produced by a consultancy for a product-labelling scheme and is vendor-published. Electronics carry about 77 per cent of the manufacturing emissions while being about 12.5 per cent of the weight. It does not generalise to an eight-accelerator server, whose accelerators and memory are a much larger part of the bill of materials.
Third, the embodied share rises as the grid cleans. Google researchers' life-cycle study of its tensor processing units, a vendor-authored preprint, reports manufacturing and transport emissions of the TPU component of a machine of 208 to 585 kg CO2e across five generations over an assumed six-year life, and finds that operational emissions dominate (about 70 per cent on market-based accounting including the company's carbon-free energy purchases, 82 per cent for the newest chip on hourly matching) (55, Schneider et al., 2025). The same paper computes a hypothetical scenario in which every data centre is matched with 90 per cent carbon-free electricity locally and hourly, using a load-weighted emission factor of 31 g CO2e per kWh observed in the regions where that level was already reached in 2023: operational emissions then fall to about 40 per cent of the total for the newest chip, and embodied emissions become the larger part. This is a vendor scenario for one chip family, not a forecast, but its point carries over: at a grid factor of 350 g/kWh the embodied term is a rounding error beside the electricity, and at 32 g/kWh it is the decision.
Materials are weaker still: the published record counts them in carbon, not in tonnes of minerals (Chapter 7). The Critical Raw Materials Act sets a 2030 benchmark of recycling capacity for at least 25 per cent of annual Union consumption of strategic raw materials (12, European Union, 2024). It does not mention data centres; the book's inference is that a buyer who asks for recycling of components containing critical raw materials adds demand for the capacity the Act wants.
An enterprise can state a lower bound for the embodied emissions of an accelerator server, or a range with its assumptions, but not a total. The HWL record therefore carries the embodied term with a status (lower_bound, estimate or supplier_figure) and its source, and a decision is tested against a range, as the worked example below does.
Utilisation: the cheapest lever
An accelerator that is switched on and idle draws power and carries its share of embodied emissions, and neither yields any work. Utilisation is the fraction of time, or of capacity, in which the machine does useful work, and it divides the footprint over the work done: the same machine at half the utilisation bears twice the embodied emissions per unit of work, and its electricity per unit of work rises by less, because the idle floor is only part of the draw.
Let a server draw P_idle when idle and P_max at full load, and let the draw at utilisation u be P_idle + u × (P_max − P_idle). The energy per unit of work is that draw divided by u. The illustrative parameters in this chapter, which Chapter 8 told every organisation to replace with its own measured values, are an idle draw of 3.2 kW and a full-load draw of 8.0 kW for the older eight-accelerator servers (idle at 40 per cent of full load is an assumption). Table 16.1 shows the result.
Table 16.1: Illustrative model: operational energy of the server (not the facility) and embodied emissions per unit of work, relative to a server at full load, for an assumed idle draw of 40 per cent of full load. Computed by the book from the stated parameters; not measured data. The embodied column is 1/u by construction.
| Utilisation | Energy per unit of work, relative to full load | Embodied emissions per unit of work, relative to full load |
|---|---|---|
| 0.30 | 1.93 | 3.3 |
| 0.52 (Hansa Mutual, September 2032) | 1.37 | 1.9 |
| 0.70 (target) | 1.17 | 1.4 |
| 0.90 | 1.04 | 1.1 |
Table 16.1 makes two points. A fleet at 0.52 uses about 37 per cent more server energy per unit of work than the same fleet at full load, and carries 1.9 times the embodied emissions per unit of work; raising it to 0.70 recovers most of both. And the effect on embodied emissions is larger than on energy, which is why utilisation grows in importance as the grid cleans. The model hides real obstacles: interactive workloads peak, a service with a latency target cannot run at 0.95, and a standby replica that looks idle is idle by design (AI Operations, Chapter 11 lists six ways in which an agent given a cost goal mistakes redundancy for waste (34, Nordqvist, 2026)). A utilisation target is therefore set per use, with a floor that raises an alert and a ceiling above which latency suffers (27, Nordqvist, 2026).
Independent evidence on real utilisation is scarce. One vendor that sells Kubernetes optimisation reported on 21 April 2026 that GPU utilisation averaged 5 per cent across the non-optimised clusters it analysed; its press release defines neither utilisation nor the sample period or GPU types, and describes the sample inconsistently (85, Cast AI, 2026). Chapter 8 treats it as a reason to measure and not as a benchmark. No independent figure for accelerators in European enterprise estates was found, so no one knows the average, and every organisation can know its own.
Utilisation rises by four means, in order of ease: retire what runs nothing (the necessity level of Chapter 12 applied to a machine); consolidate load on fewer servers; batch work that can wait into the troughs of the interactive load (Chapter 13); and move lighter work to older hardware, which is re-tiering. Each costs latency, resilience or effort, and each can be undone.
Extending life: re-tier before you retire
Three different lives are in circulation. The accounting life is the number of years over which the cost is depreciated, a financial estimate. The economic life is the period over which keeping the machine is cheaper than replacing it. The service life is how long it actually runs. Only the third has an environmental meaning, because it sets the period over which the embodied emissions are spread.
The accounting lives that the large providers disclose show how unsettled the estimate is. Amazon's annual report for 2025 states that it changed the estimated useful lives of its servers from five to six years effective 1 January 2024, and effective 1 January 2025 shortened those of a subset of its servers and networking equipment from six years to five, citing the pace of technology development, particularly in artificial intelligence and machine learning, with an increase in depreciation and amortisation expense of USD 1.4 billion for 2025 (121, Amazon, 2026). Microsoft's annual report for the fiscal year to 30 June 2026 states that servers and network equipment are generally depreciated over two to six years (151, Microsoft, 2026). The accounting lives of other large providers were not checked and are not stated. These are financial estimates, not measurements of how long accelerators run, and the filings do not separate accelerators from other servers. They show a range of two to six years and movement in both directions within two years at one provider; they cannot support a claim that accelerators last a given number of years, and no evidence was found for the one-to-two-year replacement cycle that circulates in blog posts.
Spreading the same embodied emissions over six years instead of three halves the embodied term per year of service (the time-share rule of the Software Carbon Intensity specification (21, Green Software Foundation, 2024)). The argument against is that a newer generation may do the work with less energy, so that keeping the old machine costs more electricity than the embodied emissions it saves. Which wins depends on the grid factor and the efficiency gain; the break-even is calculated below. ITU-T L.1801 sets no hardware life, so treat the life as a sensitivity parameter (Chapter 5). The lifecycle record also feeds the EMAS core indicator on materials (Chapter 24).
Between keeping a machine in its original role and retiring it lies re-tiering: moving an accelerator that is too slow for the heavy workload to lighter work. An older accelerator is a poor host for a large reasoning model and an adequate one for an embedding model, a classifier or a small summarisation model, the uses that Chapter 12 showed are adequate with a small model. It needs a design decision, not a purchase: the heavy route runs on the newest hardware, the light routes on the oldest, and the AI gateway's routing policy knows which pool is which. The limits are practical: an old accelerator may lack support for a newer software stack, may use more energy per unit of work, and may reach the end of the manufacturer's support. The HWL record carries all three, so the extension has a stated end.
Vibe to Dev, Chapter 15 makes the point for software that the cheapest time to decide the end is the start, in a sunset date that forces a decision in place of drift (37, Nordqvist, 2026); the HWL record applies it to hardware with a planned retirement date and a review date.
Retirement and take-back
Retirement is not the end of the footprint. The United Nations' Global E-waste Monitor 2024, published by UNITAR and ITU, reports 62 million tonnes of e-waste generated worldwide in 2022 for all electrical and electronic equipment, projected to reach 82 million tonnes by 2030, with 22.3 per cent documented as formally collected and recycled and recoverable resources worth USD 62 billion unaccounted for (115, UNITAR and ITU, 2024). The figures are global and cover everything from phones to refrigerators; the programme page read does not break out data-centre or AI equipment, and no source that does was found, so the figure establishes the context and no more.
The European instrument is the WEEE Directive, Directive 2012/19/EU, whose recital 20 states that priority should be given to preparing for re-use of WEEE and its components where appropriate, and whose Article 4 asks Member States to encourage cooperation between producers and recyclers and measures that promote the design and production of electrical and electronic equipment notably in view of facilitating re-use, dismantling and recovery (153, European Union, 2012). For a buyer, the end-of-life route is where a contract term carries real weight: the choice is between a recycler that shreds and a service that tests, repairs and remarkets.
Servers are named among the product groups for which the Ecodesign Regulation, Regulation (EU) 2024/1781, keeps earlier provisions in force: Article 79 continues the application of certain provisions of Directive 2009/125/EC for computers, servers and data storage products until 31 December 2026 (154, European Union, 2024). No ecodesign requirement written for AI accelerators or for AI servers was found, and a buyer should not assume that one exists. Whether one will follow is speculation (see the labels at the end), and Chapter 21 covers the regulatory picture.
A public authority that wishes to specify the end-of-life service has a ready model in the European Union's green public procurement criteria for data centres, server rooms and cloud services (SWD(2020) 55 final of 11 March 2020), which are voluntary and date from 2020 (152, European Commission, 2020). Their criterion TS4 asks a tenderer to provide a service for the re-use and recycling of the whole product or the selective treatment of components: collection, confidential handling and secure data erasure, testing, servicing, repair and upgrading for re-use, remarketing, and dismantling for component re-use or recycling. The service must report the proportions prepared or remarketed for re-use and prepared for recycling, with evidence of actions to improve recycling of critical raw materials such as cobalt in batteries and neodymium in hard disks. A companion clause, CPC3, asks the contractor to report the end destination of the equipment, including the proportion re-used or recycled and whether it stayed in the Union or was exported. These clauses turn a retirement from an event into a record. Data security is the usual reason given for destroying reusable hardware; TS4 asks for secure data erasure, and this book recommends that erasure be evidenced by a certificate, kept with the HWL record, and not by the contractor's assertion.
Buying capacity: what rent and buy do to utilisation
Owning, renting on demand and reserving for a term differ in their consequences for utilisation and for who carries the idle hours.
Owning puts all the idle capacity on the owner's books and its footprint: the energy of the idle floor and the embodied emissions of the machines, whether used or not. The owner also has full control, can meter at the rack, can re-tier and can choose the end-of-life route.
Reserving for a term commits the buyer to pay, and under the allocation rules of the Software Carbon Intensity specification to bear the footprint, for the reserved hours whether used or not, the time-share rule of Chapter 5 applied to a contract. Utilisation of the reservation is therefore the buyer's metric even though the hardware is the provider's. The buyer sees an invoice of accelerator-hours and, at best, a provider's disclosure, not the machine, its age or its idle draw. AI Operations, Chapter 11 states the conclusion that matters here: a commitment is a rate decision that cannot be undone before the term ends, so it belongs to a named person with budget authority and is outside the mandate of any agent (34, Nordqvist, 2026).
Renting on demand passes the idle capacity to the provider, who can pool it across many customers and so reach a higher utilisation than any one customer would. That is the strongest environmental argument for the cloud, and it is an argument and not evidence: the pooled utilisation is the provider's number, rarely disclosed and not verifiable by the buyer, and Chapter 8 showed that a provider's carbon tool cannot stand in for the footprint of a use.
The buyer's questions are specific. For reserved capacity: what is the minimum commitment unit and can part be released at renewal; what generation and age is the hardware, disclosed per reservation; is idle reserved capacity returned to a pool, by what rule; and what are the provider's refresh policy and end-of-life route. For on-demand capacity: does the provider disclose fleet utilisation, on what definition (ISO/IEC 30134-5, which the green public procurement criteria cite). For both: Annex VII data under Article 12 of the Energy Efficiency Directive for the facility, which an operator of at least 500 kW must report (5, European Union, 2023), and the same data per customer, which the Directive does not require and a contract can.
The green public procurement criteria again supply the wording. Criterion AC3 awards points for the anticipated annual average server utilisation (full points above 70 per cent, 0.8 of the points for 40 to 70 per cent, 0.5 for 25 to 40 per cent) and requires the modelling that supports the figure; clause CPC2 asks a third-party operator to measure and report server utilisation monthly, based on ISO 30134-5, and to report progress against targets agreed with the client (152, European Commission, 2020). They are 2020 criteria for conventional servers and do not mention accelerators; the pattern transfers, and a tender should say so. Under Article 68 of Directive 2014/24/EU a contracting authority may assess tenders on life-cycle cost, covering acquisition, use including energy, end-of-life costs such as collection and recycling, and, where it can be determined and verified, costs imputed to environmental externalities such as greenhouse gas emissions (7, European Union, 2014). The authority must state the data and method in the procurement documents, so it decides at the start whether to rank on lifecycle emissions. Chapter 23 treats procurement in full.
Efficiency of new generations and the break-even
A new accelerator generation does more work per watt. The same Google study finds that the newest of its chips offers a compute carbon intensity about three times better than the oldest it studies, and that the improvement came from a peak throughput 4.7 times that of the previous generation of the same class with manufacturing emissions up by 1.8 times; it concludes that while new chips are more carbon-intensive to make and to run, they do much more work (55, Schneider et al., 2025). That finding is on the vendor's own chips, workloads and accounting and gives no figure for any other estate. It shows the structure of the problem: a new generation costs more embodied emissions and delivers more work per unit of energy, so replacement pays if and only if the saved electricity exceeds the extra embodied emissions within the period that matters.
The calculation has three inputs, all of which the organisation must supply itself: the efficiency gain on its own workload, measured by running its own models on the candidate hardware and not read from a peak-throughput figure (peak throughput is not throughput under latency targets and variable load); the location-based grid factor at the site where the hardware will run; and the embodied emissions of the new hardware, with the sensitivity described above. The old hardware's embodied emissions are not an input to the forward decision: they have been emitted whether the machine is kept or replaced, and matter only because a longer service life spreads them over more useful work, which re-tiering and reuse capture.
Two further effects need a line each. Cheaper capacity can raise demand until the saving disappears (Chapter 10), so a refresh comes with the budget of the use and not with the assumption that load is fixed. And cost belongs in the same table as emissions, because a refresh decided on emissions alone will not survive the finance review (Chapter 20).
Practical guide: a hardware lifecycle checklist for buyers of capacity and owners of GPUs
Purpose. Decide what to do with one pool of accelerators at a renewal or refresh, in the order that spends the least embodied emissions, and record it.
Roles. The platform owner (accountable for the pool), the data-centre or energy manager (meters and facility), the sustainability lead (reviews the record), the procurement officer (contract terms and supplier disclosure), and the FinOps or capacity practitioner (utilisation and cost). A capacity agent may prepare drafts and forecasts within its mandate.
Inputs. Rack or invoice data for the last 90 days, the gateway's use-case share of the pool (Chapter 8), the supplier disclosure record for the facility, the vendor product carbon footprint or the supplier's figure for the hardware with its boundary, the contract and its renewal date, and the planned retirement date.
Steps.
- Measure utilisation of the pool over at least 90 days, separate for interactive and batch work, with the floor and ceiling per use. Record the method and the period.
- Retire what runs nothing: list reserved or owned units with no measured work for 30 days and propose release or power-down.
- Consolidate: compute the number of servers the measured load needs at the target utilisation and the energy saved by releasing the rest. This is the figure to beat.
- Re-tier: list the uses that an older accelerator serves adequately and move them, with the evaluation result of the smaller model from Chapter 12.
- Run the refresh test only after steps 1 to 4: benchmark the candidate hardware on the organisation's own workload, compute the saving at the site's location-based factor, and compute the payback of the extra embodied emissions with a stress case at three times the stated figure.
- Decide, in a record with a named owner and a date; for a commitment beyond the term, the person with budget authority signs it, never an agent.
- Specify the end-of-life route before the order: collection, erasure with a certificate, testing for re-use, remarketing, recycling with reported proportions and destination.
- Set the review date and the evidence age: 90 days for measured utilisation, 12 months for supplier figures, and the refresh test again when the load changes by more than a stated factor.
Resulting artefact. The hardware lifecycle record, below.
The hardware lifecycle record HWL
The hardware lifecycle record belongs in version control beside the footprint record (FPR) and the supplier disclosure record (SDR). For one pool of hardware, owned or reserved, it states what it is, who owns it, how it is used, what it embodies and with what status of evidence, the options, what was decided and by whom, how it ends, and when the record stops being evidence. An owner keeps an inventory in it; a buyer of reserved capacity keeps a clause set, because the buyer has no machines but has rights.
Hansa Mutual's Frankfurt record is shown in full, with illustrative figures that follow from the model in the worked example below, whose Table 16.2 gives the options.
# HWL-HM-0001: Frankfurt GPU pool (illustrative figures)
id: HWL-HM-0001
kind: inventory
pool: hansa-dc-frankfurt/gpu-platform
owner: anja-weiss                 # platform owner
facility_owner: katja-neumann     # meters and can stop the racks
reviewer: verena-lindner
created: 2032-11-08
valid_until: 2033-02-06           # 90 days: measured utilisation
inventory: {servers: 12, accelerators: 96, installed: 2029-03, planned_life_years: 5}
utilisation:
  measured: 0.52                  # period 2032-09, rack meters and gateway share
  target: 0.70
  floor_alert: 0.45
energy:
  facility_mwh_per_year: 826      # modelled: PUE 1.38, whole facility
  location_based_g_per_kwh: 350
embodied:
  status: lower_bound
  baseboard_kg_per_server: 1312   # vendor PCF, cradle-to-gate (NVIDIA, 2025)
  host_kg_per_server: 600         # assumption; proxy from a general-purpose server LCA
  excluded: [network, rack, building]
  stress_multiplier: 3
options:
  - {id: A, what: keep 12 servers,                 servers: 12, facility_mwh: 826, tco2e_year: 289}
  - {id: B, what: consolidate to 9, release 3,     servers: 9,  facility_mwh: 710, tco2e_year: 249}
  - {id: C, what: replace with 4 new,              servers: 4,  facility_mwh: 365, tco2e_year: 128, new_embodied_t: 13.7}
  - {id: D, what: 3 new for heavy, 3 old for light, servers: 6, facility_mwh: 489, tco2e_year: 171, new_embodied_t: 10.3}
decision: {aidr: AIDR-1366, chosen: B, then: benchmark-before-C-or-D, date: 2032-11-22}
stop_path: {who: katja-neumann, how: facility power control, outside_the_agent: true}
end_of_life: {route: remarket-then-recycle, erasure_certificate: required, report: [reused_share, recycled_share, destination]}
The sustainability lead checks that every figure has its boundary and the stress case was run, and the facility owner checks the metered values. After 90 days the utilisation block is expired and cannot support a claim (Chapter 8).
The buyer's record is shorter and concerns clauses. Nordvik Region's HWL-NR-0001 follows.
# HWL-NR-0001: reserved accelerators, contract NR-2026-031 (illustrative figures)
id: HWL-NR-0001
kind: clause_set
supplier: reserved-accelerators-hosting-provider
owner: ida-pettersson             # procurement manager
reviewer: astrid-nyberg
created: 2032-11-15
valid_until: 2033-02-13
reservation: {accelerators: 24, measured_utilisation: 0.58, period: 2032-Q3, target: 0.70}
need_at_target: 20                # 24 x 0.58 / 0.70, rounded up
clauses_requested:
  - release_unit: partial release of reserved accelerators at renewal
  - generation_and_age: generation and install date per reservation
  - utilisation_report: monthly, ISO/IEC 30134-5 definition, per customer pool
  - refresh_policy: notice and evidence before hardware is replaced
  - end_of_life: re-use share, recycling share, destination, erasure certificate
  - annex_vii: facility data yearly, with per-customer energy where metered
status: {sent: 2032-11-15, answered: null}
fallback: rung 3, estimate from invoiced hours and assumed draw (Chapter 8)
Unused, both records become a snapshot; the review date and evidence age prevent that, and the register of Chapter 24 lists them beside the other records of the use.
Worked example: Hansa Mutual's refresh decision (illustrative)
Hansa Mutual's Frankfurt platform has 96 accelerators in twelve eight-accelerator servers, installed in March 2029, with average utilisation 0.52, a power usage effectiveness of 1.38 and a location-based factor of 350 g CO2e per kWh, as in the profile of the organisation (all illustrative). Anja Weiß, head of the group AI platform, owns the pool, and Katja Neumann, manager of the data centre, owns its metering. In November 2032 the planned refresh is due, and the group CIO, Rainer Lehmann, asks for a decision that Dr. Verena Lindner can place in the group's reporting.
The model. All figures in this example are computed by the book from stated parameters and are not measurements. Older servers: idle 3.2 kW, full load 8.0 kW. Candidate servers: idle 3.5 kW, full load 10.0 kW, and 2.5 times the throughput per accelerator on Hansa Mutual's workload. The 2.5 is an assumption, lower than the 4.7-fold peak-throughput gain of one generation step in the vendor study; a peak figure is not a workload measurement. Embodied emissions per old server: 1,312 kg for the baseboard (the vendor figure of Chapter 7) plus 600 kg for the host, an assumption near the top of the manufacturing share of a general-purpose server study (10 to 15 per cent of 2,896 to 4,177 kg, about 290 to 630 kg). Network, rack and building are excluded, so the embodied term is a lower bound. A new server is assumed to embody 1.8 times as much, the manufacturing ratio in the Google study for one generation step. The work is the measured load of 96 accelerators at 0.52, equal to 49.9 old-accelerator equivalents.
The options. Option A keeps all twelve servers. Option B consolidates to nine old servers at a utilisation of 0.69 and releases three. Option C replaces everything with four new servers at 0.62. Option D buys three new servers for the heavy triage inference and keeps three old servers for the lighter work (embedding and classification, at 0.62), retiring the other six; the three new servers then carry the remaining work at a utilisation of about 0.58.
Table 16.2: Hansa Mutual Frankfurt pool, illustrative model. Boundary: operational, whole facility (PUE 1.38), location-based at 350 g/kWh, one year of steady load; embodied is cradle-to-gate of the server only and a lower bound. Computed by the book; not data.
| Option | Servers | Facility energy, MWh/year | Operational, t CO2e/year | New embodied, t CO2e |
|---|---|---|---|---|
| A: keep | 12 old | 826 | 289 | 0 |
| B: consolidate | 9 old | 710 | 249 | 0 |
| C: replace all | 4 new | 365 | 128 | 13.7 |
| D: staged | 3 new, 3 old | 489 | 171 | 10.3 |
What the numbers say. Consolidation alone (B) saves 116 MWh and about 41 tonnes of CO2e a year at the Frankfurt factor, with no purchase and no new embodied emissions: it is the cheapest lever, and it comes first. Replacement (C) saves a further 345 MWh and about 121 tonnes a year beyond B, on the assumed 2.5-fold gain. At 350 g/kWh the payback of C's extra embodied emissions against option A is about one month, and with the embodied term tripled about three months; at that grid factor the efficiency gain decides, not the embodied term. At a site on a grid of 32 g/kWh (Nordvik Region's factor, used here only as a sensitivity), C saves about 15 tonnes a year against A, and the payback is about eleven months with the stated embodied term and about 33 months with it tripled. On a clean grid the replacement is still inside a five-year life, but the margin is thinner and rests on the embodied estimate. Option D has the same pattern with a smaller purchase.
The tests. Count: the footprint is counted at a stated boundary (operational, whole facility, location-based), with the embodied term as a lower bound. Compare: the 2.5-fold gain is an assumption; until it is measured on Hansa Mutual's workload, option C is not shown to beat B, and the sensitivity is the point of the stress case. Cap: the platform has an energy ceiling for the pool (830 MWh a year, the facility energy of option A rounded up), measured at the rack meters of Katja Neumann's team and not by the capacity agent, and she can power the racks down through the facility power control; the agent cannot provision hardware.
The decision. On 22 November 2032 the group AI governance board, chaired by Dr. Annette Krämer, records AIDR-1366: consolidate now (option B), release three servers to a cold spare and then to the remarketing route; and ask the supplier for a benchmark on the triage workload before any order, with the payback tested at three times the embodied figure. The decision is deliberately smaller than the proposal: it takes the certain saving, defers the uncertain one until the assumption is measured, and keeps the end-of-life route (remarketing for re-use, then recycling, with an erasure certificate) in the contract of any later purchase.
Across the modes and the organisations
Across the degrees of delegation
Table 16.3 gives the degree of delegation for each class of hardware work, by how easily it is undone. Level 4 is never used for an agent that provisions or scales its own compute beyond a budget set by someone else, for an action that disables the measurement, the budget or the stop path, or for the publication of an environmental claim.
Table 16.3: Degrees of delegation for hardware work. Hansa Mutual's capacity and FinOps agent HM-OPS-004 currently acts at Level 1 Assisted, and the table does not raise it.
| Hardware work class | Highest level for an agent | Who holds the decision |
|---|---|---|
| Forecast capacity and utilisation | Level 2 | Platform owner reviews |
| Propose consolidation or re-tiering | Level 1 Assisted | Platform owner decides |
| Execute a consolidation inside an approved plan (scale down, schedule) | Level 3 within the mandate | Platform owner; undo path stated |
| Commit to a reservation or order hardware | Level 0 Advisory | Named person with budget authority |
| Retire, wipe or hand over hardware | Level 1 Assisted | Facility owner; erasure certificate checked by a person |
The reasoning follows AI Operations, Chapter 11 (34, Nordqvist, 2026): usage decisions can usually be undone and may be delegated; rate decisions and irreversible ones may not. An agent powering down servers that look idle will meet a standby replica or a restore-test environment, so that chapter's floors and windows apply. In a retirement the irreversible step is the wipe, verified by a certificate checked by a person other than the one who ordered it.
Nordvik Region and Hansa Mutual
Nordvik Region owns no accelerators. It reserves 24 accelerators from a European hosting provider under contract NR-2026-031, and the measured utilisation of the pool was 0.58 in the third quarter of 2032 against the target 0.70 and the floor alert of 0.45 (illustrative). At the target, 20 accelerators would carry the load; four reserved accelerators are therefore idle by plan, and at the EUR 1.85 per reserved GPU hour of the capacity plan of 2027 that is about EUR 65,000 a year (4 × 1.85 × 8,760, illustrative and at the 2027 price), together with their share of embodied emissions and idle draw. HWL-NR-0001 is the clause set that Ida Pettersson, the procurement manager, sends for the contract review: partial release at renewal, generation and age per reservation, monthly utilisation under the ISO/IEC 30134-5 definition, notice before a refresh and an end-of-life statement. The supplier disclosure record SDR-NR-0001 shows that the provider answered with site-level data only; an unanswered clause means the Region falls back to rung 3 of Chapter 8's ladder. Maja Lindqvist's platform team owns the pool and the gateway share, and Pär Lindgren, not an agent, signs the commitment for the next term. The Region cannot power racks down, so its stop path for work on the pool is the gateway route switch of Chapters 13 and 15, and releasing reserved capacity is a commitment decision of the person with budget authority.
Hansa Mutual owns the Frankfurt cluster, and HWL-HM-0001 and the worked example above are its record and its decision. Dr. Verena Lindner places the consolidated pool in the group's Scope 2 and Scope 3 method, and Stefan Wiedemann, head of group procurement, writes the end-of-life clauses into any later purchase. Cloud A burst capacity (up to 64 accelerators on demand) is not metered by the group; its utilisation is the provider's number.
Observable, expected, speculation
Observable. Vendor product carbon footprints for AI baseboards and a general-purpose server exist and cover part of a system (Chapter 7 and this chapter); two large providers' accounting lives for servers range from two to six years, one moving in both directions in 2024 and 2025; global e-waste generation was 62 million tonnes in 2022, with 22.3 per cent documented as formally collected and recycled; the green public procurement criteria of 2020 contain server utilisation and end-of-life clauses; Regulation (EU) 2024/1781 keeps earlier ecodesign provisions for servers until 31 December 2026.
Expected. The embodied share of an AI system rises as the grid cleans (supported by the stated trend of the grid and by the vendor scenario in the Google study).
Speculation. That ecodesign or take-back requirements written for servers or accelerators will follow under Regulation (EU) 2024/1781 (no act, date or content was found; Chapter 21 treats the legislative picture); that accelerators will have service lives of a particular length, or that a secondary market for them will be large enough to make reuse the default; no independent evidence for either was found.
Summary
This chapter concerned E3 Design at the fifth and last level of the optimisation hierarchy: hardware and lifecycle. The hierarchy ranks levers and is not a sequence of chapters: Part IV treats the levers that design the solution, hardware included, and Part V begins with place and time at level four, an operating decision. Utilisation is the cheapest lever because it needs no purchase: at the illustrative idle fraction of the chapter, a fleet at 0.52 uses about 37 per cent more server energy per unit of work than one at full load and carries 1.9 times the embodied emissions. Embodied impact is known only as a lower bound from vendor sources for part of a system, so a decision is tested against a range. Providers' accounting lives for servers, two to six years, are financial estimates and not evidence of how long accelerators serve.
The order of decisions is the main finding: consolidate before you buy, re-tier before you retire, run a refresh test on your own workload before you replace, and fix the end-of-life route before you order. In Hansa Mutual's illustrative case consolidation saves 41 tonnes of CO2e a year at the Frankfurt grid factor with nothing bought, and the larger saving from replacement rests on an efficiency gain that is an assumption until measured. The break-even depends on the grid: at 350 g/kWh the embodied term hardly matters, at 32 g/kWh a replacement can take close to three years to repay a stressed embodied estimate. A buyer of reserved capacity has the same levers through clauses, for which the 2020 green public procurement criteria supply a model and Article 68 of Directive 2014/24/EU the basis for life-cycle cost.
The hardware lifecycle record HWL holds the owner, utilisation and its evidence age, the embodied term with its status, the options and decision, the stop path outside the agent and the end-of-life route. The net-benefit tests apply: Count at a stated boundary, Compare against not buying, and Cap with an energy ceiling measured outside the agent. Chapter 17 turns to the fourth level of the hierarchy, where and when the work runs, once the machine under it has been used fully and kept long enough.
Sources
- Dell Technologies (2025). PowerEdge R760 Life Cycle Assessment. Report produced September 2025 (vendor-published; retrieved November 2026). (150, Dell Technologies, 2025)
- Amazon.com, Inc. (2026). Form 10-K for the fiscal year ended 31 December 2025. U.S. Securities and Exchange Commission (retrieved November 2026). (121, Amazon, 2026)
- Microsoft (2026). Form 10-K for the fiscal year ended 30 June 2026. U.S. Securities and Exchange Commission (retrieved November 2026). (151, Microsoft, 2026)
- European Commission (2020). EU green public procurement criteria for data centres, server rooms and cloud services. SWD(2020) 55 final, 11 March 2020 (retrieved November 2026). (152, European Commission, 2020)
- European Parliament and Council of the European Union (2012). Directive 2012/19/EU on waste electrical and electronic equipment (WEEE) (recast). Official Journal of the European Union (retrieved November 2026). (153, European Union, 2012)
- European Parliament and Council of the European Union (2024). Regulation (EU) 2024/1781 establishing a framework for the setting of ecodesign requirements for sustainable products (Ecodesign Regulation), Article 79. Official Journal of the European Union (retrieved November 2026). (154, European Union, 2024)
- European Parliament and Council of the European Union (2024). Regulation (EU) 2024/1252 (Critical Raw Materials Act). (12, European Union, 2024)
- UNITAR and ITU (2024). The Global E-waste Monitor 2024. Programme page and press release (retrieved November 2026). (115, UNITAR and ITU, 2024)
- NVIDIA (2025). PCF Summary for NVIDIA HGX H100. Vendor-reported. (46, NVIDIA, n.d.)
- Schneider, I. et al. (2025). Life-Cycle Emissions of AI Hardware. arXiv:2502.01671, vendor-authored preprint. (55, Schneider et al., 2025)
- Cast AI (2026). 2026 State of Kubernetes Optimization Report. Press release, 21 April 2026, vendor-reported. (85, Cast AI, 2026)
- European Parliament and Council of the European Union (2023). Directive (EU) 2023/1791 on energy efficiency (recast). (5, European Union, 2023)
- European Parliament and Council of the European Union (2014). Directive 2014/24/EU on public procurement. (7, European Union, 2014)
- Green Software Foundation (2024). Software Carbon Intensity (SCI) specification, adopted as ISO/IEC 21031:2024. (21, Green Software Foundation, 2024)
- Nordqvist, G. (2026). AI Platform and Security. The Transformed Architecture, Book 3. (27, Nordqvist, 2026)
- Nordqvist, G. (2026). AI Operations. The Transformed Architecture, Book 10. (34, Nordqvist, 2026)
- Nordqvist, G. (2026). Vibe to Dev. The Transformed Architecture, Book 13. (37, Nordqvist, 2026)