Crisis or Manageable Cost? A Debate
Chapter 9 asked whether one use of AI is worth its footprint, and Chapter 10 asked what happens to the total when the use becomes cheaper and grows. This chapter steps back from the single use to the question that every board paper, council debate and newspaper column on the subject eventually reaches: is the environmental cost of AI a crisis or a manageable cost? It concerns E2 Justify, because an organisation that justifies its uses one by one still needs a view of the larger argument in which its decisions sit, and because the two sides of that argument disagree about exactly what E2 asks for: how much evidence is enough before a use may start, and how much before it must stop.
The chapter stages a debate in four steps: the case for concern, the case for calm, where the positions meet and what can be done (Figure 11.1). It ends with a verdict, deliberately narrower than the question. It does not say what will happen to the climate or to the planet's grids. It says what the evidence allows an enterprise or a public authority to decide, use by use, and what it should watch in order to change its mind.
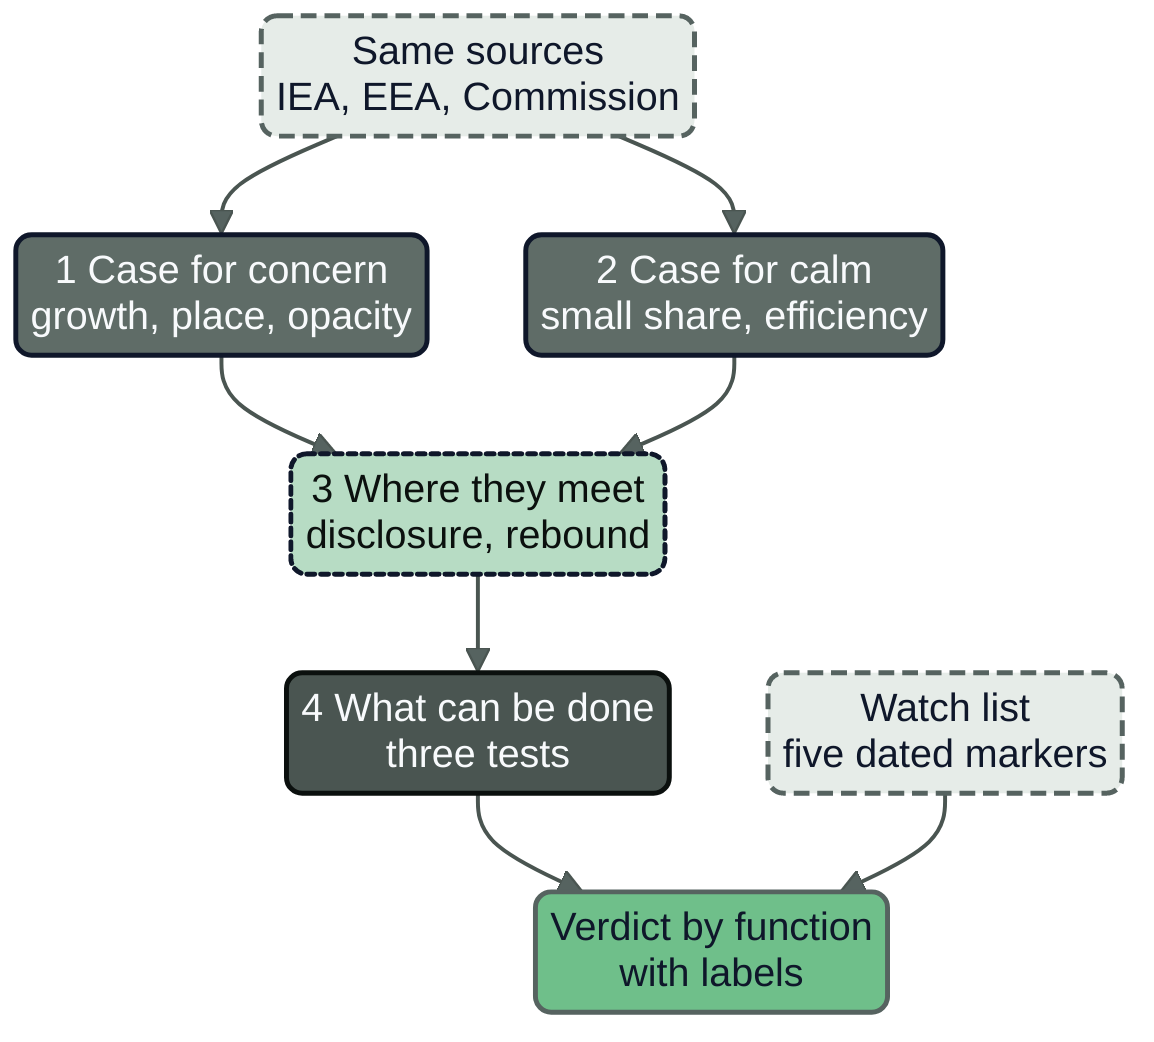
Figure 11.1: The debate in four steps. Both positions read the same sources (2026); step 4 is the three tests Count, Compare and Cap; the verdict is given by function and carries a label, and a dated watch list says what would change it.
Real figures in this chapter are as of November 2026, each with its boundary and year. The figures of Nordvik Region and Hansa Mutual are illustrative and set in the autumn of 2032, in the year of the book proper, and are labelled so.
Two readings of the same numbers
The most useful fact about this debate is that both sides draw on the same few documents. The International Energy Agency (IEA), an independent intergovernmental body whose projections both camps quote, published Key Questions on Energy and AI in April 2026 (38, IEA, 2026). Table 11.1 sets out five of its figures, each at its boundary, with the reading that a person worried about the trajectory takes from it and the reading that a person calm about it takes. Neither reading is a misquotation. The IEA's figures are modelled and projected, not measured, and the disagreement lies in what a modelled share is taken to mean for a decision.
Table 11.1: One IEA table, two readings. All figures are IEA estimates (independent; modelled or projected), for all data centres in the world unless stated.
| Figure and boundary | Reading for concern | Reading for calm |
|---|---|---|
| 485 TWh in 2025, total facility electricity, up 17 per cent on 2024 | The load grew by about 70 TWh in one year | A growth rate in line with the IEA's own projections |
| About 950 TWh in 2030, Base Case, about 3 per cent of global demand | The load roughly doubles in five years | Three per cent of demand is a small share |
| Slightly less than 10 per cent of global electricity-demand growth to 2030 | One tenth of all new demand is a large claim on the grid | Nine tenths of growth comes from elsewhere |
| About 350 Mt CO2 in 2035, about 2 per cent of electricity-sector emissions | Emissions double on the IEA's projection | Two per cent of the sector's emissions is small |
| AI-focused data centres: +50 per cent in 2025, tripling to about 465 TWh by 2030 | The fast-growing part is the part that is hardest to see | A subset, growing from a low base |
Sources for Table 11.1: (38, IEA, 2026); the 2025 growth and the 465 TWh figure are as in Chapter 2.
The IEA itself states both halves. It writes that measured per AI task, "the energy efficiency of AI is improving at a rate unprecedented in energy history", and also that "total electricity consumption from AI is set to increase in the near term" (38, IEA, 2026). A reader who quotes only the first sentence will find calm in the report, and a reader who quotes only the second will find concern. The method of this chapter is to give each position its own strongest evidence and not to pick the sentence that suits.
What the earlier volume settled
AI Threat, Chapter 17, staged a debate on the physical cost of AI as a test of one science-fiction trope, the machine that stops and the humans who forgot (29, Nordqvist, 2026). It concluded that rising data-centre electricity use is observable at the scale of a pattern, that local strain on grids and water is an incident in the wild in specific regions, that the full form of the trope, a society whose AI stops for physical reasons, remains fiction, and that an organisation's own footprint is almost entirely within its reach. This chapter takes those conclusions as settled and does not restage that debate or repeat its evidence on the trope.
The question here is different, and the evidence has moved since AI Threat was written. That volume read the IEA's report of 2025; the IEA has since published a revised base year (485 TWh for 2025) and framed the uncertainty around demand as a matter of capital-market sentiment, and a second wave of independent work has appeared on the benefit side and on public attitudes. AI Threat asked whether a story about the future was true. This chapter asks what a buyer, builder or operator should do on Monday, given two reasonable readings of the evidence that cannot both be right. That is the question E2 Justify puts at the level of the organisation.
How the debate is staged
Three rules from the authoring guide govern the debate, and the reader may hold the chapter to them.
First, each position is stated at its strongest, in the form its thoughtful holders would recognise, and treated with the same charity. Second, within each position the chapter separates what a source reports from interpretation: it says what was measured or modelled, at which boundary, in which year and by whom, before it says what that is taken to mean. Third, who speaks is stated. An advocacy network, an intergovernmental agency, a vendor and a journalist have different interests and different methods, and none of them is presented as the voice of "the science". Where a source is a vendor report or the publication of a campaign, the text says so.
Neither position is a villain. Those who warn of a crisis include energy analysts, water utilities, residents and researchers who have measured something; those who counsel calm include the agency the warning side quotes, and engineers who have cut energy per task by large factors. The chapter does not describe operators or objectors as acting in bad faith.
The debate
The case for concern
What the sources report. The case for concern begins with the trajectory and not with the current share. The IEA's Base Case has data-centre electricity roughly doubling from 485 TWh in 2025 to about 950 TWh in 2030, with the AI-focused subset tripling, and its range for 2035 runs from 700 to 1,700 TWh depending on the case (38, IEA, 2026). The IEA also reports that new uses are far more intensive than the text query on which the efficiency story rests: video generation, reasoning and agentic tasks "can consume hundreds or thousands of times more energy per query than simple text generation", and efficiency gains, by lowering cost and widening use, are "fuelling broader adoption of AI services, a dynamic known as the Jevons paradox" (38, IEA, 2026). The European Environment Agency (EEA) reaches the same structural conclusion for Europe: "Efficiency gains alone are therefore unlikely to reduce overall environmental pressures" (42, European Environment Agency, 2026).
The load is concentrated. In Ireland, data centres used 7,663 GWh of metered electricity in 2025, 23 per cent of the national total of 32,986 GWh, against 5 per cent in 2015; the Central Statistics Office notes that it identified data centres from operator names and industry sources because they are not separately classified (40, Central Statistics Office (Ireland), 2026). In Sweden, the transmission system operator Svenska kraftnät listed 8,200 MW of applied-for data-centre consumption in its connection queue on 1 November 2026, of which 6,000 MW in the electricity area SE3 (39, Svenska kraftnät, 2026). That figure counts applications, not secured capacity, and Chapter 2 explains why it cannot be turned into TWh; the case for concern uses it as an indicator of how much load is asked of a grid, not as a forecast.
On the measure that does not depend on contracts, the reported footprints of the large providers have risen. Google reported for 2025 that its electricity use rose by 37 per cent, that its Scope 2 emissions (the emissions from purchased electricity) on a location-based measure rose by 37 per cent while its market-based figure fell by about 3 per cent (the two figures are in Chapter 2), and that its total ambition-based footprint rose by 18 per cent (43, Google, 2026). The concern reading takes the location-based figure as the one closer to what the grid experienced. Microsoft's fiscal-year 2025 data sheet shows the same gap at a different scale for the whole company (Chapter 2) (44, Microsoft, 2026). Both are vendor-reported, whole-company figures that do not separate AI from the rest of the business.
The concern is also about what cannot be seen. No operator publishes the electricity of AI as distinct from all of its data-centre electricity, and no provider has published the total inference energy of a service over time (Chapter 2). The Commission's first data under Article 12 of the Energy Efficiency Directive cover 770 data centres, about 36 per cent of the sites estimated to be in scope, and the Commission says that its projections could be revised upwards; in that data, 67 sites reported any waste-heat reuse, about 1.8 per cent of the heat generated, and only 15 per cent of those that reported a refrigerant type declared one with a global warming potential below 150 (11, European Commission, 2026). The reporting duty covers buildings, not workloads, and the documentation that Article 53(1)(a) of the AI Act requires of providers of general-purpose models, which under Annex XI includes the model's known or estimated energy consumption, is kept for the AI Office and national authorities on request (1, European Union, 2024). A deployer has no direct energy duty under it and must write energy disclosure into the contract (Chapter 23).
The benefit side is thinner than the claims made for it. Ketan Joshi's report for a network of environmental organisations coded 154 claims in eight prominent sources that AI would cut emissions; 150 of them (97 per cent) concerned traditional AI and four consumer generative AI, 36 per cent cited no evidence and 26 per cent cited published academic papers (63, Joshi, 2026). A peer-reviewed general-equilibrium study by Alpine and colleagues found that productivity gains in fossil-fuel supply raise net global CO2 by 0.47 to 1.8 Gt a year, 1.2 to 4.8 per cent of 2024 energy-related emissions, in the model's assumptions (62, Alpine et al., 2026). The most cited estimate in the other direction, by Stern and colleagues, of 3.2 to 5.4 Gt a year of avoided emissions by 2035 in three sectors, expressly excludes rebound (61, Stern et al., 2025). Chapter 3 grades these claims; the concern reading takes the point to be that the benefit is a potential and the footprint is already here.
Finally, the local effects are real and organised. More than 100 organisations in 15 European countries called for a moratorium on new large data centres in early November 2026, citing effects on communities, land, water, energy bills and housing (125, Euronews, 2026). Researchers and campaigners at the Green Web Foundation argue that the case for tripling Europe's data-centre capacity has not been made, and propose a temporary pause until questions of necessity, sustainability and public interest are answered (126, Thorne et al., 2026). The IEA acknowledges the pressure: it reports that concern about local impact has led to cancellation or delay of projects, 20 projects with USD 98 billion of planned investment having been blocked or delayed in the United States in the second quarter of 2025, a figure it takes from the Data Center Watch project (38, IEA, 2026). In Spain, an environmental association, Ecologistas en Accion, has challenged the fast track that the Aragon government granted to Amazon for its data-centre development, as reported by Reuters (secondary; the article gives no water volumes) (123, Lombardi & Pons, 2026).
The strongest form of the argument. Stated at its best, the case for concern does not require the claim that AI will wreck the climate. It claims three things. The cost is growing fastest where it is least visible, in inference and in agentic work that no provider meters for the buyer. The benefit is least evidenced where the claims are loudest. And the only party able to see the cost of a particular use, the buyer, is asked to decide with no data. On that argument, a precautionary stance is a rational response to an information asymmetry, not a mood, and a pause on large new capacity until necessity is shown is a coherent proposal.
Interpretation, and where the sources stop. The sources report growth, concentration, opacity, thin benefit evidence and organised opposition. They do not show that any given catchment has run short of water because of a data centre, that the growth will continue at the Base Case rate once market sentiment changes, or that a moratorium would reduce harm and not move it. Those are inferences, and the strongest version of the argument makes them as such.
The case for calm
What the sources report. The case for calm starts from the same agency and reads its shares. On the IEA's figures data centres reach about 3 per cent of global electricity demand in 2030 and account for slightly less than 10 per cent of demand growth to 2030, and their emissions in 2035, about 350 Mt, are about 2 per cent of electricity-sector emissions (38, IEA, 2026). Carbon Brief, reproducing IEA data for 2024, put the current position at just over 1 per cent of global electricity and about 0.5 per cent of CO2 emissions, and noted that data centres are expected to make a relatively small contribution to climate change in the short term (124, Gabbatiss, 2025). A second estimate, from Chen and colleagues, projects that data centres built for AI and run by six leading operators could rise from about 118 TWh in 2024 to between 239 and 295 TWh by 2030, about 1 per cent of global electricity demand; it is a projection for a defined subset and not a measurement (53, Chen et al., 2026).
Per task, the efficiency evidence is large. The IEA writes that energy use per AI task has dropped "by at least an order of magnitude annually in recent years", that simple text queries now typically consume less electricity than running a television for the same time, and that if all conventional internet searches were performed with simple AI text queries they would use under 4 TWh a year, less than 1 per cent of present data-centre consumption (38, IEA, 2026). At one provider, the median text prompt of the Gemini Apps service used 0.24 Wh on a whole-stack boundary in May 2025, with a 33-fold fall in energy per prompt over the preceding year, as reported by the vendor (51, Elsworth et al., 2025); a Microsoft-authored bottom-up model puts a median query at 0.31 Wh on a different boundary, as a modelled estimate and not a measurement (52, Oviedo et al., 2026). Chapter 6 explains why these two figures cannot be compared.
The near-term path is also bounded by physics and finance. The IEA reports bottlenecks in grid connection, planning and a shortage of high-bandwidth memory expected to last through at least the end of 2027, and it concludes that they reduce the likelihood of the more aggressive near-term scenarios; it adds that the pace of growth "will be sensitive to market sentiment" (38, IEA, 2026). Its modelling also finds that an AI-driven boost to economic output would not lead to a proportional rise in energy demand (38, IEA, 2026).
There are measured or operator-estimated benefits too. The European Centre for Medium-Range Weather Forecasts (ECMWF) reports that its AI ensemble forecast uses approximately 1,000 times less energy than the physics-based forecasting system, an operator's estimate whose method the release does not give, while an independent 2026 preprint comparing ten-metre wind forecasts found the raw physics-based ensemble more accurate at every horizon (64, European Centre for Medium-Range Weather Forecasts, 2025) (65, Kocsis & Baran, 2026). Stern and colleagues estimate avoided emissions of 3.2 to 5.4 Gt a year by 2035 in three sectors against 0.4 to 1.6 Gt from data centres and AI, on a modelled basis (61, Stern et al., 2025). Disclosure is improving by decision, too: the Commission has adopted, and not yet published or brought into force, a delegated act for a rating scheme for data centres that would have the European database generate a label by 15 August 2027 and every year after (15, European Commission, 2026).
The strongest form of the argument. Stated at its best, the case for calm does not say that AI is free or that nothing needs doing. It says that the decision-relevant unit is the use and not the sector, that a cost can be counted, compared and capped, and that the right response to a measurable cost is measurement and budgets, not alarm. It adds that a blanket pause would forfeit uses whose benefit has been shown, and that a world in which each organisation asks what its own uses cost and what they achieve is closer to a good outcome than one in which the argument is about a global share. The calm reading can also accept the thinness of the benefit evidence: the benefits shown, such as forecasting and control, are of traditional AI, and the cost of the generative uses that concern people is small per use.
Interpretation, and where the sources stop. The sources report small shares, large per-task gains and a bounded near term. They do not show that per-task gains continue, that total AI electricity falls, or that a small global share is small where the load lands. The IEA's order-of-magnitude statement describes recent years and some tasks; the same document describes tasks that use hundreds or thousands of times more. The calm reading also has to explain why a vendor-reported, one-provider, one-year efficiency figure should carry a conclusion about a whole sector.
Where the positions meet
The positions are closer than the public argument suggests. Table 11.2 lists six points on which each side, by its own sources, accepts the other's premise, with the boundary of the evidence and what remains open.
Table 11.2: Common ground, with its evidence and what remains open.
| Point of agreement | Evidence and boundary | Open question |
|---|---|---|
| Disclosure is poor | IEA calls for systematic disclosure; Commission data cover about 36 per cent of in-scope sites, 2024 (38, IEA, 2026) (11, European Commission, 2026) | How far labels and standards reach inference |
| Boundaries decide the answer | Location-based and market-based Scope 2 differ by a factor of about five at Google, 2025, vendor-reported (43, Google, 2026) | Which basis a reader should take |
| Rebound decides the net result | IEA names Jevons; EEA: efficiency alone is unlikely to reduce pressure (38, IEA, 2026) (42, European Environment Agency, 2026) | No source measures total inference energy over time |
| Local effects are real | IEA reports cancelled or delayed projects; Irish share 23 per cent, 2025 (38, IEA, 2026) (40, Central Statistics Office (Ireland), 2026) | Which sites, and how much water, by workload |
| Benefit must be shown | Stern excludes rebound; Joshi does not deny all benefit; IEA notes rebound uncertainty (61, Stern et al., 2025) (63, Joshi, 2026) | Net global sign: Stern and Alpine disagree in method |
| The path is uncertain | IEA: growth is sensitive to market sentiment; 2035 range 700 to 1,700 TWh (38, IEA, 2026) | Whether the Base Case is exceeded or not reached |
Two of these deserve a sentence each. The first is rebound: both sides have a favourite number that looks like a test of it and is not. Google reported that the number of tokens it processes (the units of text a model reads and writes) rose sevenfold in a year, to over 3.2 quadrillion a month in May 2026 (47, Pichai, 2026), and that energy per median prompt fell 33-fold in the year to May 2025. The concerned reader sees growth outrunning efficiency; the calm reader sees efficiency keeping pace. Neither inference is licensed, because tokens and prompts are different units, the periods differ, and no total energy is published. Chapter 10 sets out the arithmetic and the measurement that would settle it.
The second is the benefit. Joshi's report concludes that "the narrative of a gigatonne-scale shift in global emissions that 'offsets' the harm of generative AI is not supported by the results", and says in the same place that the results "do not suggest AI technologies will have no climate benefits" (63, Joshi, 2026). Stern and colleagues, for their part, say that their estimate omits rebound (61, Stern et al., 2025). The two sides therefore agree on the rule that this book states as neither side pays for the other: an unproven benefit does not offset a measured footprint, and a footprint does not forbid a proven benefit.
The positions do not meet on everything. Whether Europe should pause new large capacity until necessity is shown is a question of values and of political economy that the evidence in this chapter does not settle, and the book does not settle it. What the evidence does settle is narrower and more useful for an organisation: on every row of Table 11.2 the first actions are the same under either reading, as Table 11.3 shows.
What can be done
An enterprise or public authority cannot decide the world's grid or the rate of the build-out. It can decide which uses to run, how to count them, what to put in contracts and what to watch. Those decisions are the method of Chapter 4, and Table 11.3 shows that most are the same under either reading, which makes them safe to take before the argument is resolved.
Table 11.3: Decisions that hold under both readings, and the one that depends on the reading.
| Decision | If concern is right | If calm is right | Chapter |
|---|---|---|---|
| Count every use at a stated boundary and year | Reveals growth early | Shows that the cost is small | 4, 8 |
| Compare with the non-AI alternative and with rebound | Stops low-value uses | Confirms high-value ones | 9, 10 |
| Cap each use and agent with a budget and an outside stop path | Limits damage | Costs little | 4, 15 |
| Write disclosure into contracts and tenders | Creates the missing data | Cheap insurance | 23 |
| Decline a use whose benefit is not shown | Removes load | Loses nothing shown | 9 |
| Place and time work where grid and water allow | Cuts local strain | Cuts carbon and cost | 17 |
| Size long commitments (reserved capacity, multi-year terms) | Short terms with options | Longer terms are cheaper | 19, 23 |
Only the last row depends on the reading. A long reserved-capacity contract is cheaper per unit if demand grows and a liability if it does not, so the sensible answer to uncertainty is the structure that is good under both: a shorter term, a right to shrink and an exit test (as Chapter 23 and AI Operations, Chapter 11 treat capacity and cost practice) (34, Nordqvist, 2026). The rest of the table needs no view on the crisis.
The same logic applies to the claims an organisation makes. An organisation whose sustainability statement says that its AI work "became more efficient" has taken a side without evidence. The method requires that the claim passes Count and Compare before it is published, and that a named person with authority to speak for the organisation, not an agent, publishes it (Chapters 22 and 24).
Finally, the position of the individual buyer is a position of influence. A public authority that puts an environmental annex in every AI tender, or a group that asks each hosted provider for the same per-request figures, adds demand for disclosure at the point where the debate says it is missing. Neither the concerned nor the calm reading disputes that.
What would change the verdict
A verdict that cannot change is a position. This section turns the debate into a small, dated instrument: the markers whose movement would move an organisation from acting on the calm reading to acting on the concerned one, or back. The thresholds are the organisation's own choices, they are illustrative here, and each has a date and an owner.
Practical guide: a watch list of five markers
Purpose. Agree in advance what evidence would change the organisation's stance, so that the decision is made on the marker and not on the mood of the week.
Roles. The owner of the environmental register (at Nordvik Region the CIO, at Hansa Mutual the head of the group AI platform) keeps the list; the sustainability lead reviews it; procurement supplies the disclosure marker; the board or council receives it at each review.
Inputs. The environmental register (Chapter 4), the footprint and benefit records of every use, the latest IEA and Commission publications, and the contract calendar.
Steps.
- Choose five markers, one for each of disclosure, outside demand, own rebound, benefit evidence and regulation. Each must be observable: a number with a source and a date, or an event.
- State the default reading the organisation acts on until a trigger fires. Most organisations will start with calm-with-caps: all the decisions of Table 11.3, and no freeze.
- Set a trigger for each direction, with the date by which it is checked, and name what the organisation does when it fires.
- Record the list as a decision in an AI Decision Record, so that the stance and its triggers are in version control.
- Review every 90 days, which is the evidence age of a running use in this book, and on any event named in a marker.
- When a trigger fires, change the stance by decision, with a new AI Decision Record, and not by drift.
Artefact. A watch list record, kept beside the register. The record below is Nordvik Region's, as illustrative as every figure of the organisations.
# register/watch-nr-0001.yaml  (illustrative; Nordvik Region, set 2032-10-18)
watch_list: WCH-NR-0001
decision_record: AIDR-1311
owner: henrik-dahl
reviewer: astrid-nyberg
review_every_days: 90
default_reading: calm-with-caps
markers:
  - id: M1
    name: disclosure coverage
    measure: share of register uses with a footprint record inside its evidence age
    baseline: {value: 0.17, date: 2032-10-04}   # 1 of 6 uses
    toward_concern: below 0.50 on 2033-03-31, then no new use without a footprint record
    toward_calm: at or above 0.83 on 2033-06-30
  - id: M2
    name: outside demand
    measure: IEA Base Case for 2030 and the Svenska kraftnät data-centre queue
    baseline: {iea_twh_2030: 950, queue_mw: 8200, date: 2026-11-01}
    toward_concern: Base Case revised up by more than 10 per cent, or queue above 10250 MW
    toward_calm: Base Case revised down by more than 10 per cent
  - id: M3
    name: own rebound
    measure: monthly energy, volume and energy per unit of each register use (Chapter 10)
    baseline: {citizen_enquiries_per_month: 168000, date: 2032-09-30}
    toward_concern: total energy up more than 30 per cent in 12 months without a benefit record
    action: Cap review of the use
  - id: M4
    name: benefit evidence
    measure: uses whose benefit record is graded measured in deployment and under 180 days old
    baseline: {value: 0, of: 6}
    toward_concern: still 0 on 2033-06-30, then decline renewal of any use without one
  - id: M5
    name: regulation and rating
    measure: rating act in force, and grade of the hosting site at its first label
    event: first label due 15 August 2027 once the act is in force
    toward_concern: site graded below D, then use the exit clause of TA-NR-ENV-01
The record parses as YAML and is read as follows. Marker M1 and M4 come from the Region's own register and tell it whether it can see its estate at all; the debate's common ground is that a use with no footprint record and no benefit record cannot be defended to either side. Marker M2 is outside the organisation and cannot be controlled, which is why it is the only one whose trigger changes nothing about what the Region does today and only how long it commits for. Marker M5 depends on an act that the Commission adopted on 21 September 2026 and that has not been published in the Official Journal; it enters into force 20 days after publication, and the first labels are due by 15 August 2027 (15, European Commission, 2026). The grades run from A to G on power and water usage effectiveness; whether the Region's hosting site will be graded below D is unknown, which is why the marker is an event and not a forecast.
Its figures age as every figure in the book does: a marker whose source is older than the review interval is stale, and the review says so.
Verdict
The verdict answers the question the organisation can answer. It is given by function, and each statement carries one of the three labels of AI Governance, Chapter 22 (26, Nordqvist, 2026): observable (happening now and documented), expected (supported by a stated trend or a decided instrument) or speculation (plausible but unevidenced). The author's own projections are reserved for Chapters 25 and 29, and nothing here is one.
E1 Measure. It is observable that no operator publishes the electricity of AI separately from all data-centre electricity, that no provider has published total inference energy over time, and that the Commission's first reporting data cover about 36 per cent of sites in scope (11, European Commission, 2026). It is expected that disclosure improves, because the rating scheme and standards in preparation are decided or announced instruments, though their reach to the energy of an inference request is not yet decided. Whether the numbers will become comparable across providers is speculation.
E2 Justify. It is observable that data-centre electricity grew by 17 per cent in 2025, that energy per AI task has fallen sharply at the providers that report it, and that the evidence for AI's environmental benefit is mostly of traditional AI and mostly asserted or modelled (38, IEA, 2026) (63, Joshi, 2026). It is expected, on the IEA's own statement of its Base Case, that total AI electricity use rises in the near term although energy per task keeps falling. It is speculation whether efficiency will keep pace with demand, and whether the net global effect of AI on emissions is positive or negative: the two peer-reviewed models, Stern's and Alpine's, differ in sign because they model different channels, and neither is a ledger.
E3 Design and E4 Operate. It is observable that the levers an organisation controls (the use it declines, the model it chooses, where and when it runs work, the contract term it signs) are within its reach, and that the IEA reports software improvements as having delivered some of the largest reductions in energy per AI task, often without new capital investment (38, IEA, 2026). It is expected that local constraints on grids and permits continue where load concentrates, as in Ireland and the Swedish queue, so that place and time are a design question and not a courtesy. Whether a particular site will be refused a connection is speculation until the operator decides.
E5 Account. The book's own conclusion, from Chapter 4 and from the common ground above, is that an environmental claim without a boundary, a baseline and an independent check cannot be defended to either side of this debate. It is expected that claims will be read against stricter rules, as Chapter 22 shows against the live text. How a claim will be received by a particular regulator or court is speculation.
On the question itself. Crisis or manageable cost is not a property of AI. At the level of the world, the evidence in this chapter does not decide it, and the label for any firm answer is speculation. At the level of an organisation, it is a property of each use, and the book's conclusion is that the cost of a use is manageable when it has been counted at a stated boundary, compared with the alternative and with the rebound it causes, and capped with a stop path outside the system. A use that has passed none of these is neither a crisis nor a manageable cost; it is an unmanaged one, and the calm reading and the concerned reading both advise the same thing about it.
What can be influenced. Almost everything that bears on the verdict for the organisation is within its reach: its register, its contracts, its placement, its claims and its watch list. The pace of the build-out, the planning of grids and the standards that decide what providers disclose are beyond any single organisation, but influenced by what organisations ask for in procurement and say in consultations.
Across the modes and the organisations
Across the degrees of delegation
The two positions imply different comfort with machine action on resources, and Table 11.4 sets out what each would accept per action class, as the book's reading of what each position implies, not a quotation from anyone. The ceiling in the last column is the book's, from Chapter 4, and applies whatever the evidence of past performance.
Table 11.4: What each position would accept per action class, and the book's ceiling (the book's reading, not a quotation).
| Action class | Concern would accept | Calm would accept | Book's ceiling |
|---|---|---|---|
| Measure and estimate | Level 3 Bounded, with outside checks | Level 3 Bounded | Level 3; the reviewer is not the agent |
| Recommend a model, placement or budget | Level 1 Assisted | Level 2 Supervised | Level 3 |
| Schedule deferrable work | Level 2 Supervised | Level 3 Bounded | Level 3 |
| Provision or scale compute | Level 1 Assisted, to a budget | Level 3 Bounded, to a budget | Level 2 Supervised within the budget; never Level 4 beyond a budget set by someone else |
| Stop a use at its budget | Gateway control, not a delegated act | Gateway control, not a delegated act | Stop path outside the system stopped |
| Publish an environmental claim | Level 0 Advisory | Level 1 Assisted | Level 1 Assisted (drafting); never Level 4 |
On Mode 5, the autonomous production agents of the series, the concerned reading says that an agent that can start work can spend resources, that its energy per completed task is unmetered, and that it should carry a budget before it carries a mandate. The calm reading says that a budget set by someone else and a stop path outside the agent make the agent's cost as manageable as any other use. These positions meet: Chapter 15 gives the budget and the stop path, and the book's ceiling is the same under both. At Modes 0 to 2, where the organisation cannot meter the use itself, both readings send it to the supplier's disclosure, and the watch list's first marker records how many such disclosures exist.
Nordvik Region and Hansa Mutual
The two organisations read the same paper and ask different first questions. Both sets of figures are illustrative.
Nordvik Region. In October 2032 the regional council debates a draft regional plan, prepared in the regional development unit under the climate and environment strategist Astrid Nyberg, that would invite data-centre investment on the region's grid and district-heating system. Councillors read the same IEA and Svenska kraftnät numbers as Table 11.1 and the case for concern in the press, and the first question that several of them ask is how much of the grid and the region's water a data centre takes. The Region cannot answer that for a site that does not exist, and it does not control the grid; it controls its own purchases. The regional director, Elisabet Holmgren, accordingly asks the CIO, Henrik Dahl, what the Region's own AI estate costs, and he answers from the register: one of six uses has a footprint record inside its evidence age (the open-weight route of the citizen-service assistant, FPR-NR-0001, of the order of 1 g CO2e per resolved enquiry on an operational, location-based boundary; the draft records of Chapters 6 and 8 give 0.52 g and 0.98 g by different methods), the hosted route has no figure, and the enquiry volume has grown from 71,000 in October 2026 to about 168,000 a month. The Region's answer to the council is therefore a procurement requirement and a watch list. In the re-tender of the hosting contract NR-2026-031 the tender annex TA-NR-ENV-01, run by the procurement manager Ida Pettersson, asks for the site's grid, per-customer energy and water and sets a term with an option to shrink, and the watch list WCH-NR-0001 is adopted on 18 October 2032 (AIDR-1311). The paper is a public record under the Swedish public-access rules, so the Region writes it to be read by both camps.
Hansa Mutual. The board reads the group's sustainability statement under the Corporate Sustainability Reporting Directive and asks what AI adds to Scope 2 and Scope 3. The honest answer is that it cannot be separated: at the baseline the platform racks in Frankfurt metered about 62 MWh in September 2032, about 85.6 MWh at the facility boundary with a power usage effectiveness of 1.38, which at 350 g/kWh location-based is of the order of 30 t CO2e for the month, but the burst capacity in Cloud A is not metered by the group, the hosted providers' figures are partial and on different boundaries, and the market-based figure, with guarantees of origin, is lower. The head of group sustainability, Dr. Verena Lindner, adds that the board's statement that AI work at the group "became more efficient" has no claim record behind it. The chief risk officer, Dr. Annette Krämer, who chairs the group AI governance board, holds the statement from publication until CLM-HM-0001 exists and records the board's stance on 25 October 2032 (AIDR-1361): it acts on the calm reading with all the decisions of Table 11.3, reports location-based and market-based figures side by side, and sets triggers for the five markers in its own watch list WCH-HM-0001. Its first question is one of accountability: what can the group prove, and who signs it.
Summary
Whether AI's environmental cost is a crisis or a manageable cost cannot be settled on present evidence at the level of the world, and the book labels any firm answer speculation. Both camps draw on the same sources. On the IEA's figures, data-centre electricity was 485 TWh in 2025, grew 17 per cent, and roughly doubles to about 950 TWh in a Base Case for 2030, about 3 per cent of global demand and slightly under 10 per cent of demand growth. The case for concern reads trajectory, concentration, opacity and rebound; the case for calm reads small shares, large per-task gains and a near term bounded by physical and financial limits.
The positions meet on disclosure, on boundaries, on rebound as the open question, on local effects and on the rule that a benefit must be shown and not assumed. On those points the same actions follow from either reading: Count every use at a stated boundary and year, Compare it with the alternative and its rebound, Cap it with a budget and an outside stop path, write disclosure into contracts, decline uses without shown benefit, place and time work with care and keep long commitments short enough to change. A dated watch list of five markers records what would change the stance. The verdict for E1 Measure to E5 Account is given with labels, and for the organisation the answer is operational: an AI use is a manageable cost when it has been counted, compared and capped, and an unmanaged one when it has not.
The chapter concerns E2 Justify. Chapter 12 opens Part IV and E3 Design, with the first and largest lever after necessity: choosing the right model for the task.
Sources
- International Energy Agency (2026). Key Questions on Energy and AI. World Energy Outlook Special Report, April 2026. https://www.iea.org/reports/key-questions-on-energy-and-ai (retrieved November 2026). Independent; modelled and projected figures. (38, IEA, 2026)
- Nordqvist, G. (2026). AI Threat: Are the Dystopias Coming True? Evidence, Risk and Response for European Enterprises and Public Authorities. The Transformed Architecture, Book 5, published at aithreat.geon.se. Chapter 17. (29, Nordqvist, 2026)
- European Environment Agency (2026). Europe must steer AI and digitalisation to support its green transition. News release, 5 May 2026. https://www.eea.europa.eu/en/newsroom/news/europe-must-steer-ai-and-digitalisation-to-support-its-green-transition (retrieved November 2026). Press release; the briefings behind it were not read. (42, European Environment Agency, 2026)
- Central Statistics Office, Ireland (2026). Data Centres Metered Electricity Consumption 2025. https://www.cso.ie/en/releasesandpublications/ep/p-dcmec/datacentresmeteredelectricityconsumption2025/keyfindings/ (retrieved November 2026). The release header and the statistician's comment give inconsistent years for the release date (2025 and 2026). (40, Central Statistics Office (Ireland), 2026)
- Svenska kraftnät (2026). Information om pågående anslutningsärenden (statistics as at 1 November 2026, page reviewed 10 November 2026). https://www.svk.se/aktorsportalen/anslut-till-transmissionsnatet/information-om-pagaende-anslutningsarenden/ (retrieved November 2026). (39, Svenska kraftnät, 2026)
- Google (2026). 2026 Environmental Report. Google LLC, 30 June 2026. https://sustainability.google/files/google-2026-environmental-report.pdf (retrieved November 2026). Vendor-reported; endnotes state that the data and claims have not been independently verified. (43, Google, 2026)
- Microsoft (2026). 2026 Environmental Data Fact Sheet. Microsoft Corporation, fiscal year 2025 (to 30 June 2025). https://cdn-dynmedia-1.microsoft.com/is/content/microsoftcorp/microsoft/msc/documents/presentations/CSR/2026-Microsoft-Environmental-Data-Fact-Sheet-PDF.pdf (retrieved November 2026). Vendor-reported. (44, Microsoft, 2026)
- European Commission (2026). Report on the energy efficiency of data centres in the EU. COM(2026) 500 final, 21 September 2026. https://build-up.ec.europa.eu/system/files/2026-10/39-2026-48_Report%20on%20the%20energy%20efficiency%20of%20data%20centres%20in%20the%20EU.pdf (retrieved November 2026). Figures of 68 and 114 TWh are cited from outside estimates; reporting data cover about 36 per cent of sites in scope. (11, European Commission, 2026)
- European Parliament and Council of the European Union (2024). Regulation (EU) 2024/1689 (Artificial Intelligence Act). Article 53(1)(a) and Annex XI, consolidated text of 27 July 2026. (1, European Union, 2024)
- Joshi, K. (2026). The AI Climate Hoax. Beyond Fossil Fuels with Friends of the Earth US, Stand.earth, Green Screen Coalition, Green Web Foundation and Climate Action Against Disinformation, February 2026. https://beyondfossilfuels.org/wp-content/uploads/2026/02/AI-for-climate-claims-Report_FEB-2026_FINAL-2-16.pdf (retrieved November 2026). Publication of advocacy organisations. (63, Joshi, 2026)
- Alpine, W., Geldner, N., Alpine, H. and Chepeliev, M. G. (2026). AI-driven productivity gains enable more CO2 emissions than they avoid in a global energy-economy model. npj Climate Action 5, 71, 4 August 2026. https://doi.org/10.1038/s44168-026-00411-0 (retrieved November 2026). (62, Alpine et al., 2026)
- Stern, N., Romani, M., Pierfederici, R., Braun, M., Barraclough, D., Lingeswaran, S., Weirich-Benet, E. and Niemann, N. (2025). Green and intelligent: the role of AI in the climate transition. npj Climate Action 4, 56, 23 June 2025. https://doi.org/10.1038/s44168-025-00252-3 (retrieved November 2026). (61, Stern et al., 2025)
- Euronews (2026). Protesters across Europe to call for freeze on energy-hungry data centres. 5 November 2026. https://www.euronews.com/2026/11/05/protesters-across-europe-to-call-for-freeze-on-energy-hungry-data-centres (retrieved November 2026). News report of a campaign; the positions are those of the campaign. (125, Euronews, 2026)
- Thorne, M., Gomez Delgado, A., Jansen, F., Leonard, R., Lutz, A. and Nieto, E. (2026). The case for a moratorium on large data centers in Europe. Green Web Foundation, 30 July 2026 (summary of an op-ed in Tech Policy Press). https://www.thegreenwebfoundation.org/news/the-case-for-a-moratorium-on-large-data-centers-in-europe/ (retrieved November 2026). Advocacy position; the page gives no measurements of its own. (126, Thorne et al., 2026)
- Lombardi, P. and Pons, C. (2026). Fast-track permits turn Spain's Aragon into a $70 billion data centre magnet. At what cost? Reuters, 6 October 2026 (wire copy read through a news aggregator; secondary source). https://finance.yahoo.com/technology/articles/fast-track-permits-turn-spains-080834341.html (retrieved November 2026). (123, Lombardi & Pons, 2026)
- Gabbatiss, J. (2025). AI: Five charts that put data-centre energy use and emissions into context. Carbon Brief, published 15 September 2025, last modified 15 July 2026. https://www.carbonbrief.org/ai-five-charts-that-put-data-centre-energy-use-and-emissions-into-context/ (retrieved November 2026). Journalism reproducing IEA figures of 2024 and 2025; secondary. (124, Gabbatiss, 2025)
- Chen, D., Zhou, Z., Cai, Y., Katchova, A. L. et al. (2026). Artificial intelligence data centers could reach one percent of global electricity demand by 2030. Communications Sustainability 1, 147, 21 September 2026, DOI 10.1038/s44458-026-00152-5. https://www.nature.com/articles/s44458-026-00152-5 (retrieved November 2026). Projection, not a measurement; six authors in the Crossref record. (53, Chen et al., 2026)
- Elsworth, C., Huang, K., Patterson, D., Schneider, I., Sedivy, R., Goodman, S., Townsend, B., Ranganathan, P., Dean, J., Vahdat, A., Gomes, B. and Manyika, J. (2025). Measuring the environmental impact of delivering AI at Google Scale. arXiv:2508.15734, 21 August 2025. https://arxiv.org/abs/2508.15734 (retrieved November 2026). Vendor-authored. (51, Elsworth et al., 2025)
- Oviedo, F., Kazhamiaka, F., Choukse, E., Kim, A., Luers, A., Nakagawa, M., Bianchini, R. and Lavista Ferres, J. M. (2026). Energy use of AI inference, efficiency pathways, and test-time scaling. Joule 10(8), August 2026, DOI 10.1016/j.joule.2026.102430; preprint arXiv:2509.20241. https://arxiv.org/abs/2509.20241 (retrieved November 2026). Microsoft-authored; a bottom-up model estimate, not a measurement. (52, Oviedo et al., 2026)
- European Centre for Medium-Range Weather Forecasts (2025). ECMWF's ensemble AI forecasts become operational. News release, 1 July 2025. https://www.ecmwf.int/en/about/media-centre/news/2025/ecmwfs-ensemble-ai-forecasts-become-operational (retrieved November 2026). (64, European Centre for Medium-Range Weather Forecasts, 2025)
- Kocsis, M. and Baran, S. (2026). AI and physics-based weather forecasting: A comparative study. arXiv:2606.02508, 1 June 2026 (preprint). https://arxiv.org/abs/2606.02508 (retrieved November 2026). (65, Kocsis & Baran, 2026)
- European Commission (2026). Commission Delegated Regulation supplementing Directive (EU) 2023/1791 as regards the establishment of a common Union rating scheme for data centres. C(2026) 3472 final, 21 September 2026 (adopted by the Commission, not yet published in the Official Journal; the number in the act is a placeholder). https://eur-lex.europa.eu/legal-content/EN/TXT/?uri=PI_COM%3AC%282026%293472 (retrieved November 2026). (15, European Commission, 2026)
- Pichai, S. (2026). I/O 2026: Welcome to the agentic Gemini era. Google, 19 May 2026. https://blog.google/innovation-and-ai/sundar-pichai-io-2026/ (retrieved November 2026). Vendor-reported; tokens processed across Google's surfaces, not energy. (47, Pichai, 2026)
- Nordqvist, G. (2026). AI Operations: How Artificial Intelligence Transforms IT Operations in European Enterprises and Public Authorities. The Transformed Architecture, Book 10, published at aiops.geon.se. Chapter 11. (34, Nordqvist, 2026)
- Nordqvist, G. (2026). AI Governance: Governing Artificial Intelligence in European Enterprises and Public Authorities. The Transformed Architecture, Book 2, published at aig.geon.se. Chapter 22. (26, Nordqvist, 2026)