Rebound and Growth: Induced Demand and the Limits of Efficiency
Chapter 9 taught the second test of the net-benefit principle, Compare, as three comparisons: against the baseline, against the non-AI alternative and against the rebound the use causes. This chapter takes the third. Rebound is the gap between the saving that an efficiency gain promises and the saving that shows up in the total, and it arises because a use that costs less per unit tends to be used more. The chapter concerns E2 Justify. It asks what is known about rebound in general and in AI, what is not known, how an organisation measures its own rebound with the register it already keeps, and what it does when the measurement says that volume has outrun efficiency.
The chapter is modest about the evidence. Per-unit figures for AI have fallen steeply and are measured, at stated boundaries, by some providers; totals for data centres have risen. What is missing is a measured series that joins the two for the same boundary and period, and the chapter says so first.
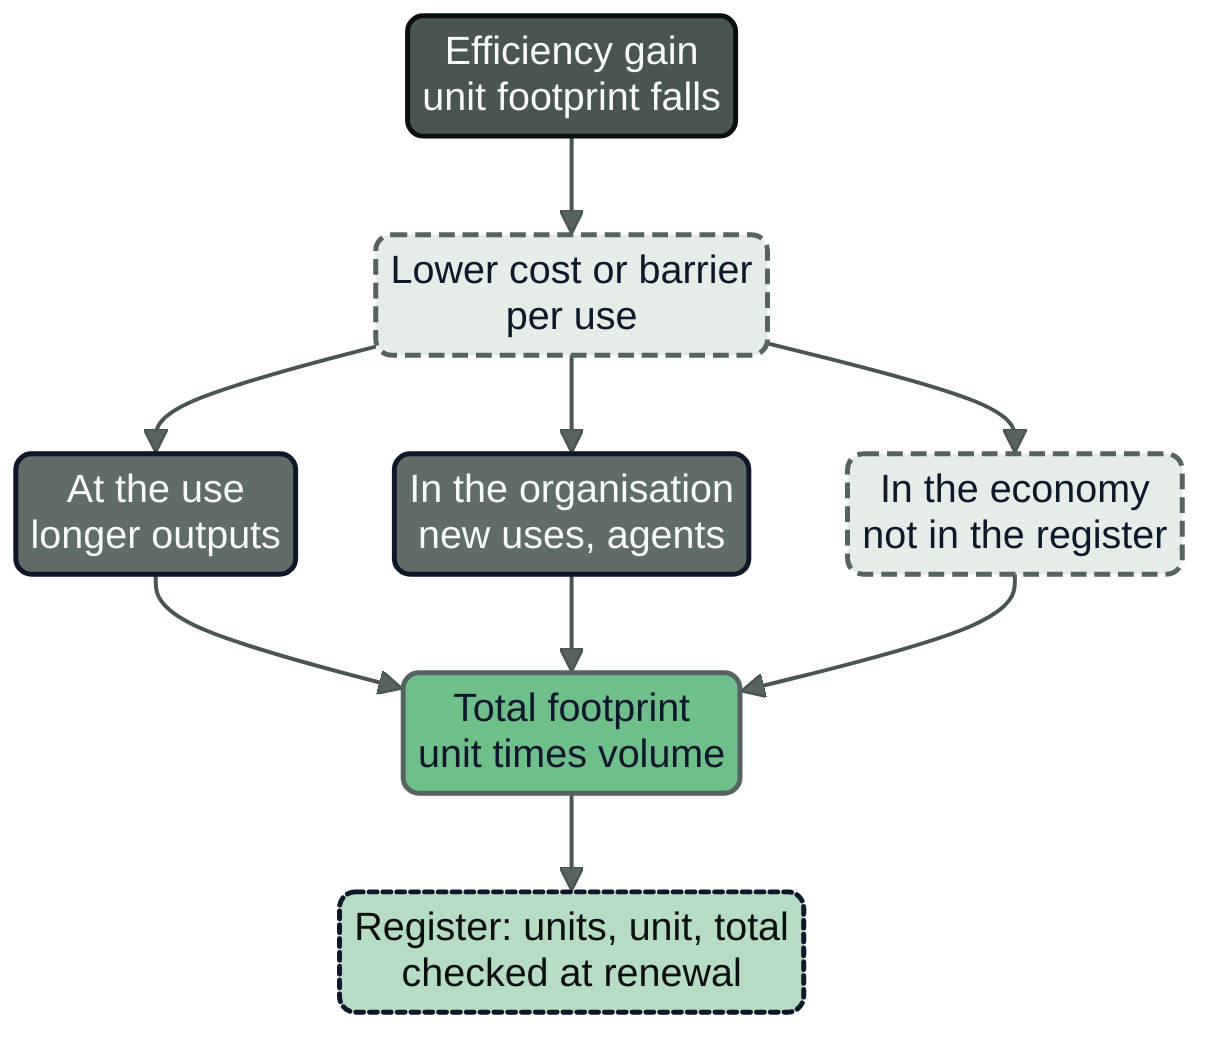
Figure 10.1: Rebound at three levels. The organisation measures the first two in its register; the third lies outside it. No figure is carried by the diagram.
A halved cost, a doubled volume
Chapter 4 gave the arithmetic of the Region's citizen-service assistant. In October 2026 the assistant resolved 71,000 enquiries in the month, a figure the Region measured. By September 2032 the profile gives about 168,000 a month, a growth of 2.4 times (illustrative from 2032). The Region's footprint figure for the service comes from AI Platform and Security, Chapter 22 (27, Nordqvist, 2026), and covered the 71,000. Chapter 4 showed that a fall of 30 per cent in energy per enquiry would still leave the total at 1.68 times its former size. That is the whole problem in one line: a unit figure and a volume figure multiply, and a report that shows only the first can be true and misleading at the same time. AI Operations, Chapter 15 reached the same conclusion for cost: the price of a fixed capability fell steeply, but the bill is price times quantity, and a falling unit price shown without the volume beside it misleads (34, Nordqvist, 2026). The labels used below, observable, expected and speculation, are those of AI Governance, Chapter 22 (26, Nordqvist, 2026).
Imagine that the Region's platform team replaces the model on the open-weight route with a smaller one, and that the per-enquiry energy of the route halves. A good measurement shows the halving and the monthly volume. If volume stands still, the total halves. If volume doubles, the total is exactly where it started, and the Region has paid for a model swap, a test cycle and a change record in order to arrive at the same electricity bill with twice the service. That is not a failure of the swap; it may be a success of the service, since twice as many citizens got an answer. It is a failure only if the Region reports the swap as an environmental saving. The difference between those two statements is what this chapter is about.
Two cautions belong at the start. First, not every rise in volume is rebound. Volume can rise because a campaign told citizens about the service, because a new law created new enquiries, or because the population of users grew; none of these is a response to the lower unit cost, and the second half of the chapter shows how to keep them apart. Second, a rebound is not necessarily bad. A use whose benefit is large and shown may deserve more volume. What the net-benefit principle forbids is counting the efficiency gain as a saving that the total does not contain.
Kinds of rebound
The economics literature on rebound is older than AI and concerns energy services in general. Gillingham, Rapson and Wagner (2016) define the rebound effect as the gap between the expected and the realised energy savings from an efficiency improvement, and they separate studies of a costless efficiency increase from studies of particular efficiency policies, because the two have different welfare and policy implications (58, Gillingham et al., 2016). This book uses three levels, its own grouping of that literature, named after where an organisation can see them (Figure 10.1).
Rebound at the use. The same use becomes more frequent or heavier per task once each unit is cheaper or faster. A handler who gets an answer in two seconds instead of eight asks more questions; an assistant whose reasoning effort costs little is left at a higher setting; a context that is cheap to resend is resent with more material attached. The organisation sees this in the gateway: calls per task, tokens per call, units per month for one use.
Rebound in the organisation. The saving frees budget, capacity or attention that goes to other uses of AI. A cheaper claims model makes a second task worth automating; a platform with spare reserved capacity becomes the obvious place to add a feature; an agent that can start work starts more of it. The organisation sees this in the register as new rows, and as growth of the pool that the use shares with others.
Rebound in the economy. Lower unit cost across the market raises demand for AI services in general, changes what is built, and shifts prices of the inputs, including energy. No single organisation can measure this level, and it is the level on which most of the public argument about Jevons' paradox is conducted. Luccioni, Strubell and Crawford (2025) apply the paradox, the idea that efficiency gains can increase total consumption, to AI and argue that the debate has concentrated on direct impacts such as data-centre energy and hardware waste and has largely ignored indirect effects; the paper is conceptual and does not measure a rebound (56, Luccioni et al., 2025).
A separate idea, induced demand, concerns supply rather than efficiency: when capacity grows or becomes cheaper, the use that the capacity serves grows to fill it. The best-known evidence is from roads. Duranton and Turner (2011) found, for the interstate highways of United States cities, that vehicle kilometres travelled rose in proportion to the highways provided, and concluded that building roads is unlikely to relieve congestion (59, Duranton & Turner, 2011) (the finding was read in the working-paper abstract, retrieved November 2026). The road case does not prove that AI behaves the same way. It shows that a system can absorb a whole increase in capacity, a pattern an organisation with reserved accelerators should recognise in its own pool: spare capacity invites use.
What the energy economics says in general
Two findings from the general literature bear on how much to expect. Sorrell, Dimitropoulos and Sommerville (2009), reviewing the empirical estimates of the direct rebound effect, conclude that for household energy services in the OECD it should generally be less than 30 per cent, and they note sources of bias that may lead to overestimation (57, Sorrell et al., 2009) (the conclusion was read in the RePEc abstract, retrieved November 2026). Gillingham, Rapson and Wagner (2016) conclude that the research gives little support to the backfire hypothesis, in which efficiency gains raise total energy use, and they state that understanding of the macroeconomic rebound effect remains limited, particularly for induced innovation and productivity growth (58, Gillingham et al., 2016).
Neither finding transfers to AI inference without a test. Both concern household energy services, such as heating and driving, whose demand has a natural ceiling. The demand for tokens has none: a use can read more context, reason longer, call more tools and run more often, limited only by cost, and software can start a use without a person asking. The general literature sets a prior that rebound is partial in mature, saturated services and says little about a service whose unit of work is elastic by design.
What is known for AI
The evidence has three layers, and they must be kept apart because they have different boundaries. The first is the unit: the energy of one prompt, one query or one task. The second is the volume: how many prompts, tokens or tasks. The third is the total: the electricity of a company, a fleet of data centres or the world. Table 10.1 lists the measured or reported quantities of each layer that the research for this chapter could verify at the source, with their boundaries. They are not comparable with one another; the table is a map, not a calculation.
Table 10.1: Per-unit, volume and total figures for AI, with boundary and year (retrieved November 2026).
| Quantity | Boundary and period | Source | Vendor or independent | What it shows |
|---|---|---|---|---|
| Energy per median Gemini Apps text prompt fell by a factor of 33 | Whole stack (accelerators, host, idle capacity, overhead), May 2024 to May 2025 | (51, Elsworth et al., 2025); (43, Google, 2026) | Vendor | The unit falls |
| Tokens a month, Google surfaces: 9.7 trillion, about 480 trillion, over 3.2 quadrillion | Tokens, all surfaces, one month a year, about May 2024, May 2025 and May 2026 | (47, Pichai, 2026) | Vendor | The volume rises |
| Google total electricity up 37 per cent in 2025, after 27 per cent in 2024 | All operations, calendar years 2024 and 2025 | (43, Google, 2026) | Vendor | The company total rises |
| Data-centre electricity 485 TWh in 2025, up 17 per cent | All data centres worldwide, 2025, estimates | (38, IEA, 2026) | Independent | The world total rises |
| AI-built data centres of six operators: 118 TWh in 2024, 239 to 295 TWh in 2030 | Six operators, projection | (53, Chen et al., 2026) | Independent, a projection | Expected growth |
The unit falls
Google's authors report that the median Gemini Apps text prompt used 0.24 Wh at the whole-stack boundary in May 2025, and that over the twelve months to that month the energy of the median prompt fell by a factor of 33 and the total carbon footprint by a factor of 44 (51, Elsworth et al., 2025) (43, Google, 2026). The company states that the 33-fold figure is a point-in-time analysis that does not represent all prompts or indicate future performance, and the carbon figure includes procurement of clean energy as well as efficiency. The figures are vendor-reported and among the few of their kind. Microsoft's authors model the median query of a frontier-scale model at 0.31 Wh and a reasoning query of about 5,000 output tokens at 3.91 Wh, and describe pathways that could take the median to about 0.11 Wh and 0.08 Wh and a combined reduction of 8 to 20 times (52, Oviedo et al., 2026). That paper is a bottom-up model, not a measurement, and its pathways are expected, conditional on adoption. The International Energy Agency puts the same observation in one sentence: measured per task, the energy efficiency of AI is improving at a rate unprecedented in energy history (38, IEA, 2026) (observable as a statement of the agency's assessment in April 2026).
The volume rises
The same company reports that it was processing 9.7 trillion tokens a month across its surfaces two years before May 2026, roughly 480 trillion a year before, and over 3.2 quadrillion in May 2026, which it describes as a sevenfold rise in a year (47, Pichai, 2026). A token is the unit into which a model splits text; the count includes every surface and the programming interfaces that other organisations call. The figures are a vendor's keynote statement, unaudited.
The total rises
Google's environmental report states that its total electricity consumption grew by 37 per cent in 2025, up from 27 per cent in 2024, to support all its products and digital services including AI, and describes the rate as tempered by its AI-stack efficiencies (43, Google, 2026) (vendor-reported) (the report states that its data have not been independently verified). The International Energy Agency's estimate for all data centres worldwide in 2025 is 485 TWh, up 17 per cent on 2024 (38, IEA, 2026). The European Commission's report on data-centre energy efficiency repeats outside estimates of 68 TWh in the EU in 2024 and 114 TWh in 2030, which is expected growth, not measurement (11, European Commission, 2026). Chen and colleagues project the AI-built data centres of six large operators from about 118 TWh in 2024 to between 239 and 295 TWh in 2030, which is a projection and not a rebound study (53, Chen et al., 2026).
What the three layers do and do not show
All three layers have moved as rebound would produce: the unit has fallen, the volume has risen faster, and the totals have risen. That is consistent with the Jevons effect, and with other explanations. Volume may have risen because many more people and organisations began to use AI, because products were redesigned around it and because capital spending on capacity outran demand, none of which needs the lower unit cost as its cause. The total may include a shift to heavier modes of use, such as reasoning and agents. The IEA reports that video generation, reasoning and agentic tasks can consume hundreds or thousands of times more energy per query than simple text generation (38, IEA, 2026). A rising total can therefore be a mix shift as much as a rebound.
There is also a plain problem of arithmetic. The tokens counted across Google's surfaces grew roughly 50 times between about May 2024 and May 2025 (the book's own division of 480 trillion by 9.7 trillion), while the energy of the median Gemini Apps text prompt fell by a factor of 33 in the same twelve months. Those two numbers cannot be combined into a change in total energy: one counts tokens across all surfaces, the other is the energy of a median prompt of one product; tokens per prompt are not given; and a median is not a mean. Nor can the company's 37 per cent rise in total electricity in 2025 bound the electricity of AI, since a component can grow faster than the total. The published figures cannot decide the question.
No measured series of total tokens against total energy was found. The research looked for a series that gives, for one provider or fleet and one boundary, the volume of work and the energy used over several periods, so that energy per unit and volume could be separated. None was found in a primary source. A preprint on the Research Square server is titled as a longitudinal audit of token prices, demand and energy from 2022 to 2026; the page available showed only its title, so it is not relied on. The statement that rebound has been measured for AI inference is not supported by the evidence available to this book, and neither is the statement that it has been shown to be small. The question is open.
The economy-wide level
At the level of the economy there are two studies that bear on the sign of the effect and neither is a measurement of AI inference. Stern and colleagues estimate that AI could reduce global emissions by 3.2 to 5.4 GtCO2e a year by 2035 in three sectors, and state that their analysis does not consider rebound effects such as efficiency gains in AI leading to increased consumption (61, Stern et al., 2025). Alpine and colleagues model productivity gains from AI in fossil-fuel supply in a global general-equilibrium model and find that net annual emissions rise by 0.47 to 1.8 Gt CO2, because the emissions enabled exceed those avoided whenever the fossil gains are nonzero (62, Alpine et al., 2026). Both are scenario-based models with assumed productivity shocks. They do not net out into a ledger; they show that the sign of the economy-wide effect depends on where AI raises productivity, and that a benefit estimate without rebound is an upper bound. The IEA's April 2026 report adds that its new modelling finds that the impact of an AI-driven GDP boost on energy demand is lower than the increase in GDP in most regions (38, IEA, 2026). The European Environment Agency states the institutional position in one sentence: efficiency gains alone are therefore unlikely to reduce overall environmental pressures (42, European Environment Agency, 2026). That is a judgement of an agency, published on 5 May 2026, and not a measurement of AI.
Inside the organisation
An organisation cannot measure the economy. It can measure its own estate, and its own estate has the same mechanisms at small scale. Four are common enough to be put in the register as drivers.
More uses. A saving that makes one use cheaper makes the next use easier to justify. The Region's staff assistant, the correspondence classifier and the case-note summaries came one after the other on the same reserved pool, and each added load to a pool whose utilisation target is 0.70. The register's row count is itself a rebound series.
Longer outputs and heavier settings. Chapter 6 showed how the multipliers enter a use: the reasoning setting, the output length, the context and the number of calls. Oviedo and colleagues model a reasoning query of about 5,000 output tokens at 3.91 Wh against 0.31 Wh for the median query, a ratio of roughly 13 (52, Oviedo et al., 2026) (modelled). A model swap that lowers the energy of a plain call can be followed by a product decision to raise the effort setting, because quality has become affordable, and the first change is then spent on the second.
More agents and more calls per task. An agent that can start work starts more of it when the unit gets cheaper. Hansa Mutual's claims-triage agent makes an average of nine model calls per claim (Chapter 6, illustrative); if a cheaper model lowers the energy per call by a quarter and the agent's plan grows to twelve calls, the energy per claim is unchanged, because 12 divided by 9 is 1.33 and 0.75 times 1.33 is 1. The efficiency gain was real and the saving was zero.
Always-on features. Ambient and embedded AI switched on for every user of a licensed suite changes volume without any person choosing it. The organisation often cannot meter this volume and enters it in the register as a supplier-reported row. Rebound here is a default, set by a supplier, and the lever is the contract (Chapter 23), not the gateway.
Measuring rebound
An organisation measures rebound with three series per use, kept side by side in the register and reviewed together: the units (the functional unit of the use, from the gateway), the unit footprint (energy per unit from the footprint record, at a fixed boundary), and the total (the metered or attributed energy of the use). The first two multiply to the third; the third is measured independently where a meter exists, so that the product can be checked against it and the check is recorded. Plotted as three lines indexed to the baseline month at 100, the unit line falls, the volume line rises, and the total line shows the outcome.
Let u be the unit footprint now divided by the unit footprint at baseline, and v the volume now divided by the volume at baseline. The total moves by u times v. If the unit footprint fell (u below 1), the expected saving was 1 minus u, the realised saving is 1 minus u times v, and the rebound is one minus the ratio of the realised to the expected saving. When u is one half, the rebound is v minus 1: a volume 1.5 times the baseline gives a rebound of 50 per cent, a volume of 2 times gives 100 per cent, and a volume above 2 gives more than 100 per cent, which is the case economists call backfire. The formula is the book's own arithmetic.
Two conditions make the number meaningful. The first is that the boundary of the unit footprint is the same at both dates: a figure that adds embodied emissions in one month and omits them in the next, or that moves from a metered boundary to a modelled one, produces a change of u that is a change of method. Chapter 8's rules on evidence age apply, and so does the rule of Chapter 4 that a change of model, version, hardware, region, supplier, contract or volume expires the record. The second is that the cause of the volume change is known. A volume change that coincides with the change in unit footprint, on a date that the change log records, is a candidate for rebound. A volume change that coincides with a campaign, a new statute or a change in the user population is growth, reported beside the rebound figure with the cause named. Where the two cannot be separated, the register says so and reports the combined figure as the upper bound on the rebound. Uses that did not change are the comparison: if two services on the same pool grew alike and only one changed its model, the difference in their growth is the better estimate of the induced part.
Practical guide: a rebound check
Purpose. Show, for one use and one period, whether efficiency gains have been kept or spent, and what caused the volume change.
Roles. The use's owner (the AI product owner or the named owner in the register), the platform engineer who supplies gateway counts and meter readings, the sustainability lead who signs the boundary of the unit footprint, and the register owner who receives the trigger report.
Inputs. The register row of the use, the footprint record at baseline and the latest, the gateway counts of units, calls per unit and tokens per call, the change log of models, settings and features with dates, and the metered or attributed energy of the pool.
- Fix the baseline. Choose the month of the footprint record as the baseline and write its units, its unit footprint and its boundary in the row.
- Take the three series. Read the units from the gateway, the unit footprint from the latest footprint record, and the total from the meter or the attribution; compute the product and compare it with the total, tolerating the difference that the measurement plan allows (Chapter 8).
- Compute u, v and the rebound. Use the formula above; if u is not below 1, report the total factor only.
- Name the cause of the volume change. Check the change log and the calendar for model changes, setting changes, new features, campaigns, statutes and user-population changes, and for each write one of three words: induced, independent or unknown.
- Check the drivers. Compare calls per unit, output tokens per call, routes enabled and features on by default with the baseline, because a rise in any of them inflates u in the next record.
- Decide and record. Compare the factors with the triggers in the row, report a breach to the register owner, and record the decision (continue, cap, redesign, decline renewal) with its date.
Artefact. The rebound block of the register row, shown below, in version control.
The register row
The row below extends the environmental register of Chapter 4 for the citizen-service assistant of Nordvik Region. The baseline is the footprint record FPR-NR-0001 of Chapter 6 (illustrative). The trigger of a volume factor of 1.2 is the one set in the environmental budget EBG-NR-0001; the planned change is an assumption for this example.
# register/environment-nr.yaml (extract). Illustrative.
- use: FPR-NR-0001
  service: SVC-NR-005
  owner: henrik.dahl
  budget: EBG-NR-0001
  rebound:
    unit: resolved enquiry
    boundary: operational, GPU servers and host with facility overhead, location-based, no embodied
    baseline: {period: 2032-09, units: 146000, wh_per_unit: 16.34, record: FPR-NR-0001}
    series:
      units: {source: ai-gateway, cadence: monthly}
      wh_per_unit: {source: FPR-NR-0001, cadence: quarterly, valid_days: 90}
      total_kwh: {source: provider-meter, cadence: monthly}
    drivers: [calls_per_enquiry, output_tokens_p50, routes_enabled, features_default_on]
    triggers: {volume_factor: 1.2, unit_factor_rise: 1.1}
    planned_changes:
      - {date: 2032-11-08, change: "smaller model on the open-weight route", expected_unit_factor: 0.5}
    reviewer: astrid.nyberg
    next_review: 2033-03-31   # before the re-tender decision on NR-2026-031
The computation is a few lines of Python 3.12 that belong beside the register so that the check is repeatable. It reads two periods and returns the three factors and the rebound; its output for the worked example below is the 2.0 row of Table 10.2.
from dataclasses import dataclass

@dataclass
class Period:
    units: float        # functional units in the period
    wh_per_unit: float  # measured at one stated boundary

def rebound(base: Period, now: Period) -> dict:
    u = now.wh_per_unit / base.wh_per_unit
    v = now.units / base.units
    out = {"unit_factor": round(u, 3), "volume_factor": round(v, 3),
           "total_factor": round(u * v, 3)}
    if u < 1:
        out["rebound_pct"] = round(100 * (1 - (1 - u * v) / (1 - u)), 1)
    return out

base = Period(146_000, 16.34)
print(rebound(base, Period(292_000, 8.17)))
# {'unit_factor': 0.5, 'volume_factor': 2.0, 'total_factor': 1.0, 'rebound_pct': 100.0}
Worked example (illustrative): a model swap that halves the unit and doubles the volume
Take the baseline of Chapter 6: 146,000 resolved enquiries in September 2032 at 16.34 Wh each (FPR-NR-0001, revision 1, facility boundary; this is not the 27.7 Wh of Chapter 4, which is GPU-and-host energy of October 2026 before facility overhead and is aged, so the two differ in boundary and year), which is 2,385 kWh a month at the stated boundary and, at 32 g CO2e per kWh location-based, 76 kg CO2e. The Region swaps the model so that the energy per enquiry halves to 8.17 Wh. Table 10.2 shows the total under four assumed volumes. All figures are illustrative and the grid factor is held constant.
Table 10.2: A model swap that halves the energy per enquiry, under four volumes (illustrative; operational, facility boundary, location-based at 32 g/kWh).
| Volume factor | Enquiries a month | Total energy (kWh) | Total (kg CO2e) | Rebound |
|---|---|---|---|---|
| 1.0 | 146,000 | 1,193 | 38 | 0 per cent |
| 1.5 | 219,000 | 1,789 | 57 | 50 per cent |
| 2.0 | 292,000 | 2,385 | 76 | 100 per cent |
| 2.5 | 365,000 | 2,981 | 95 | 150 per cent |
The row for a volume factor of 2.0 is the case of the opening: the total is where it started. The trigger of 1.2 in the register row fires at 175,200 enquiries a month, long before any of the later rows is reached, and the first action on a breach is not to reverse the swap. It is to ask which of the three words applies to the volume. If the cause is a campaign, the Region reports the growth as independent, the saving as real per enquiry, and the total as higher, and asks whether the benefit record of Chapter 9 still carries the larger volume. If the cause is a larger number of calls per enquiry or a higher reasoning setting, the cause is inside the Region's control and the next record shows it in the unit figure.
Responding
A measurement that nobody acts on is a report. The response has three instruments, and the last is the Cap test of Chapter 4.
Budgets and quotas. The environmental budget sets a ceiling on energy for the use, measured outside the use, so that a rise in volume reaches a limit that someone other than the use's owner has set. The breach ladder of Chapter 4 (80, 100 and 110 per cent of the budget) is the response to a total; the rebound trigger is the earlier warning that comes from the ratio of volume to baseline, before the total has reached the budget. Quotas on the drivers act at the source: a limit on output tokens per call, a maximum number of calls per task for an agent, a ceiling on the reasoning setting, and a default of off for new ambient features until the use has a footprint record.
A stop path outside the system. The use can be switched to a fallback by someone who is not the use. For FPR-NR-0001 the stop path of EBG-NR-0001 is the gateway route switched to the published FAQ page and the phone service, held by Henrik Dahl and the platform on-call; a stop path that has not been drilled in 90 days does not count as a cap. No agent holds the authority to raise its own volume limit or its own budget, which is the Level 4 prohibition of Chapter 4 applied to volume.
Review at renewal. A rebound check is a standing item at the three moments when a use is renewed: when the model or supplier changes, when the contract is renewed, and when the budget is set for the year. At each, the owner shows the three series since the last review and the cause of any volume change, and the register owner records whether the use continues at its volume, continues at a lower cap, is redesigned or is declined.
Limits of the claim
First, no source read for this book measures total inference energy against total volume, for one boundary and one provider over several periods. The pattern of falling unit figures and rising totals is an observation about three different quantities; it is consistent with rebound without demonstrating it.
Second, the per-unit figures of Table 10.1 are vendor-reported or modelled at different boundaries and were not independently audited in the sources read. The volume figure is a keynote statement, and the one independent figure, the IEA's, is an estimate, not a meter reading.
Third, the general literature concerns saturated household services. Its findings (a direct rebound below 30 per cent; little support for backfire) are a prior, not a result for AI, and give an organisation whose own series show more than 100 per cent for a use no reason to doubt its data.
Fourth, the rebound that an organisation measures is that of one use under its own decisions. It excludes the organisation's effect on the market and on its users' behaviour outside the use, which are benefit-side effects treated in Chapters 3 and 9.
What follows for the benefit case
A benefit record compares the use with its baseline and with the non-AI alternative at a stated volume. If volume is expected to grow, the record states the volume at which the comparison holds and the volume at which it stops holding, and it carries the rebound series of the register as a field: the expected volume factor, the observed one, the cause and the date. A use whose benefit per unit is shown and whose volume is capped is judged on its total; a use with uncapped volume is judged on the footprint at the volume it is likely to reach.
Two rules follow from the net-benefit principle. An unproven benefit does not offset a measured footprint, and an unmeasured rebound does not count as zero: where it has not been measured, the benefit case states that its total footprint is a lower bound. And a saving reported to a board, a regulator or the public is the saving in the total, not in the unit. A report that says energy per enquiry halved and omits that volume doubled is a claim without its boundary, and the claim record of Chapter 22 does not pass it.
Observable, expected, speculation
Observable. Per-unit energy of AI inference has fallen at the boundaries that providers report (a factor of 33 for a median prompt in the year to May 2025, vendor-reported). Token volumes reported by one provider have risen about sevenfold in the year to May 2026, its total electricity rose 37 per cent in 2025, and the International Energy Agency estimates that data-centre electricity worldwide rose 17 per cent in 2025. These are separate observations at separate boundaries.
Expected. Aggregate data-centre demand is expected to continue to rise to 2030 in the central projections of the IEA, the European Commission's report and Chen and colleagues, on the strength of announced capital spending and the growth of energy-intensive uses such as agentic tasks, which the IEA describes as increasingly popular. Efficiency per unit is expected to keep improving at a rate that makes the unit figure of any use a moving quantity, so that a footprint record is renewed on a change of model and not only by the calendar.
Speculation. Whether efficiency gains will keep pace with volume, whether the market-level rebound for AI inference will approach, exceed or stay below one, and whether any provider will publish a series that makes the question testable are speculation on the evidence available in November 2026. The book makes no projection of its own here.
Across the modes and the organisations
Across the usage modes
Rebound arises differently in each mode, and so does the party who can cap it. Table 10.3 states, for each mode, how volume grows after a unit gain and who holds the lever.
Table 10.3: Rebound by usage mode and who can cap it.
| Mode | How volume grows | Visible in | Who can cap it |
|---|---|---|---|
| Mode 0 Ambient AI | Supplier switches features on for all users | Supplier report only | Procurement, by contract |
| Mode 1 Conversational assistants | More users, longer sessions | Seat and token counts | Licence owner, by seats and limits |
| Mode 2 Embedded workplace assistants | Feature on by default in every document | Supplier report, sampled | Platform lead, by default settings |
| Mode 3 Agentic work tools | More tasks started, more calls per task | Gateway runs per user | Platform lead, by run budgets |
| Mode 4 Built AI applications | More routes, features and volume | Gateway units per use | Use owner and register owner |
| Mode 5 Autonomous production agents | Agent starts work without a request | Runs and calls per task | Budget holder, outside the agent |
Level 4 is never used for an agent that starts work beyond a budget set by someone else, and none of the caps in the last column may be held by the agent it limits. An agent's volume limit and its stop path sit with the budget holder, and a request by an agent to raise its own limit is an event for a person to review, not an action to be approved by the agent's own mandate.
Nordvik Region and Hansa Mutual
Nordvik Region. The citizen-service assistant (FPR-NR-0001, SVC-NR-005) is the Region's example of volume outrunning the unit, from 71,000 to about 168,000 enquiries a month. Its rebound row is the register extract above, and the question at the first breach is the cause of the volume. A campaign is the likelier cause than a price response, since the citizen does not see a cost, and the Region reports such growth as independent. The part of the volume that the Region controls is the share of enquiries sent to the eligibility-explanation route (FPR-NR-0002, a hosted model whose energy is undisclosed): a rise there raises a total that the Region cannot measure at all, which is a reason to cap that route by volume until Chapter 23's tender annex TA-NR-ENV-01 brings the disclosure.
Hansa Mutual. The claims assistant (FPR-HM-0001) answers about 1.1 million queries a month for about 2,900 handlers (illustrative, September 2032). Its footprint is reported monthly under the routing and carbon policy RP-HM-CLAIMS-2026-02 on a partial boundary, so the first step of the check is to fix a boundary with Katja Neumann's rack metering and Jan Berger's showback before any swap, because a rebound figure needs the same boundary at both dates. For a smaller model that lowers the unit by 40 per cent, the volume at which the total returns to baseline is 1 divided by 0.6, or 1.67 times, which at the present volume is about 1.8 million queries a month. The risk the register watches is the task mix: handlers who find the cheaper tool fast enough to use for new tasks, such as drafting file notes. The gateway therefore tags each query with its task class, so that a rise in volume is attributed to a class that existed at baseline or to a new one. The claims-triage agent (FPR-HM-0002) is checked on calls per claim as well as claims: nine calls per claim at baseline, a driver in the row, and its budget, above the threshold, is approved by the group AI governance board chaired by Dr. Annette Krämer. Dr. Verena Lindner owns the method for counting the result in Scope 2 and Scope 3, and any statement of efficiency to the board is a claim record that names the total, not the unit (CLM-HM-0001, Chapter 22).
Summary
Rebound is the gap between the saving that an efficiency gain promises and the saving that the total contains. General energy economics finds it partial in mature household services, with little support for backfire. For AI the evidence has three kinds that do not combine: per-unit energy that providers report falling steeply, volumes that one provider reports rising about sevenfold in a year, and totals that the provider and the International Energy Agency report rising. That pattern is consistent with Jevons' paradox and with simpler explanations, and no measured series of total tokens against total energy was found that could decide between them.
The organisation can measure what it controls: three series per use (units, unit footprint, total) in the register at a fixed boundary, a rebound figure computed from them, a named cause for any volume change (induced, independent or unknown), and triggers that report a breach to the register owner. The response is the budget with a stop path outside the system, quotas on the drivers of volume and review at renewal, which is the Cap test applied to volume. The benefit case carries the rebound, and a saving reported outside the organisation is a saving in the total.
The chapter concerns E2 Justify and supplies the third comparison of the Compare test. Chapter 11 takes the question left open here, whether the totals are a crisis or a manageable cost, and stages it as a debate. Chapters 12 to 16 give the levers that lower the unit, so that the check has something to protect. The reader can start by adding the three series to the register row of one use and running the check once on the volume of the last twelve months.
Sources
- Nordqvist, G. (2026). AI Governance: Governing Artificial Intelligence in European Enterprises and Public Authorities. The Transformed Architecture, Book 2. (26, Nordqvist, 2026)
- Nordqvist, G. (2026). AI Platform and Security: Building and Securing AI Platforms in European Enterprises and Public Authorities. The Transformed Architecture, Book 3. (27, Nordqvist, 2026)
- Nordqvist, G. (2026). AI Operations: How Artificial Intelligence Transforms IT Operations in European Enterprises and Public Authorities. The Transformed Architecture, Book 10. (34, Nordqvist, 2026)
- International Energy Agency (2026). Key Questions on Energy and AI. World Energy Outlook Special Report, April 2026. Independent; modelled and projected figures. (38, IEA, 2026)
- European Commission (2026). Report on the energy efficiency of data centres in the EU. COM(2026) 500 final, 21 September 2026. (11, European Commission, 2026)
- Google (2026). 2026 Environmental Report. Google LLC, 30 June 2026. Vendor-reported; read in the PDF, November 2026. (43, Google, 2026)
- Elsworth, C. et al. (2025). Measuring the environmental impact of delivering AI at Google Scale. arXiv:2508.15734, 21 August 2025. Vendor-authored. (51, Elsworth et al., 2025)
- Oviedo, F. et al. (2026). Energy use of AI inference, efficiency pathways, and test-time scaling. Joule 10(8), August 2026. A bottom-up model estimate, not a measurement. (52, Oviedo et al., 2026)
- Chen, D. et al. (2026). Artificial intelligence data centers could reach one percent of global electricity demand by 2030. Communications Sustainability 1, 147, 21 September 2026. Projection. (53, Chen et al., 2026)
- Stern, N. et al. (2025). Green and intelligent: the role of AI in the climate transition. npj Climate Action 4, 56, 23 June 2025. (61, Stern et al., 2025)
- Alpine, W., Geldner, N., Alpine, H. and Chepeliev, M. G. (2026). AI-driven productivity gains enable more CO2 emissions than they avoid in a global energy-economy model. npj Climate Action 5, 71, 4 August 2026. (62, Alpine et al., 2026)
- Pichai, S. (2026). I/O 2026: Welcome to the agentic Gemini era. Google, 19 May 2026. Vendor statement; read at the source, November 2026. Available at: https://blog.google/innovation-and-ai/sundar-pichai-io-2026/. (47, Pichai, 2026)
- Luccioni, A. S., Strubell, E. and Crawford, K. (2025). From Efficiency Gains to Rebound Effects: The Problem of Jevons' Paradox in AI's Polarized Environmental Debate. ACM FAccT 2025; arXiv:2501.16548. Conceptual; abstract read, November 2026. Available at: https://arxiv.org/abs/2501.16548. (56, Luccioni et al., 2025)
- European Environment Agency (2026). Europe must steer AI and digitalisation to support its green transition. News release, 5 May 2026. Available at: https://www.eea.europa.eu/en/newsroom/news/europe-must-steer-ai-and-digitalisation-to-support-its-green-transition (accessed 2026-11). (42, European Environment Agency, 2026)
- Sorrell, S., Dimitropoulos, J. and Sommerville, M. (2009). Empirical estimates of the direct rebound effect: A review. Energy Policy 37(4), 1356-1371. Abstract read via RePEc, November 2026. Available at: https://doi.org/10.1016/j.enpol.2008.11.026. (57, Sorrell et al., 2009)
- Gillingham, K., Rapson, D. and Wagner, G. (2016). The Rebound Effect and Energy Efficiency Policy. Review of Environmental Economics and Policy 10(1), 68-88. Abstract read, November 2026. Available at: https://doi.org/10.1093/reep/rev017. (58, Gillingham et al., 2016)
- Duranton, G. and Turner, M. A. (2011). The Fundamental Law of Road Congestion: Evidence from US Cities. American Economic Review 101(6), 2616-2652; working paper NBER 15376 (2009), abstract read, November 2026. Available at: https://www.nber.org/papers/w15376. (59, Duranton & Turner, 2011)