Cloud, Sovereign or On-Premises: Choosing on Environmental Evidence. A Debate
Where an AI use runs is one of the decisions that an organisation makes once and then lives with for years. It is usually made on grounds of cost, law, security and capability, which AI Platform and Security, Chapters 13 and 14 treat in full (27, Nordqvist, 2026). This chapter asks only the environmental question: among hyperscale cloud, sovereign or regional cloud and capacity the organisation owns or colocates, what evidence separates the options? It follows Chapter 18 and concerns E4 Operate, the function that places, times, hosts, runs and observes AI under budgets and stop paths, at the place-and-time level of the optimisation hierarchy. It serves the Count, Compare and Cap tests, and it stages the debate in four steps, the case for concern, the case for calm, where the positions meet and what can be done, before a verdict.
The chapter reaches two conclusions that readers on either side may not expect. The first is that the evidence published so far does not rank the three options: the only head-to-head comparison found was commissioned by a cloud provider and rests on a simulated on-premises baseline. The second is that the label of an option settles little. Four things carry most of the difference: how busy the accelerators are, which grid feeds the site in which hour, how efficient the facility is, and whether the buyer can see any of it. Each option can be strong or weak on each.
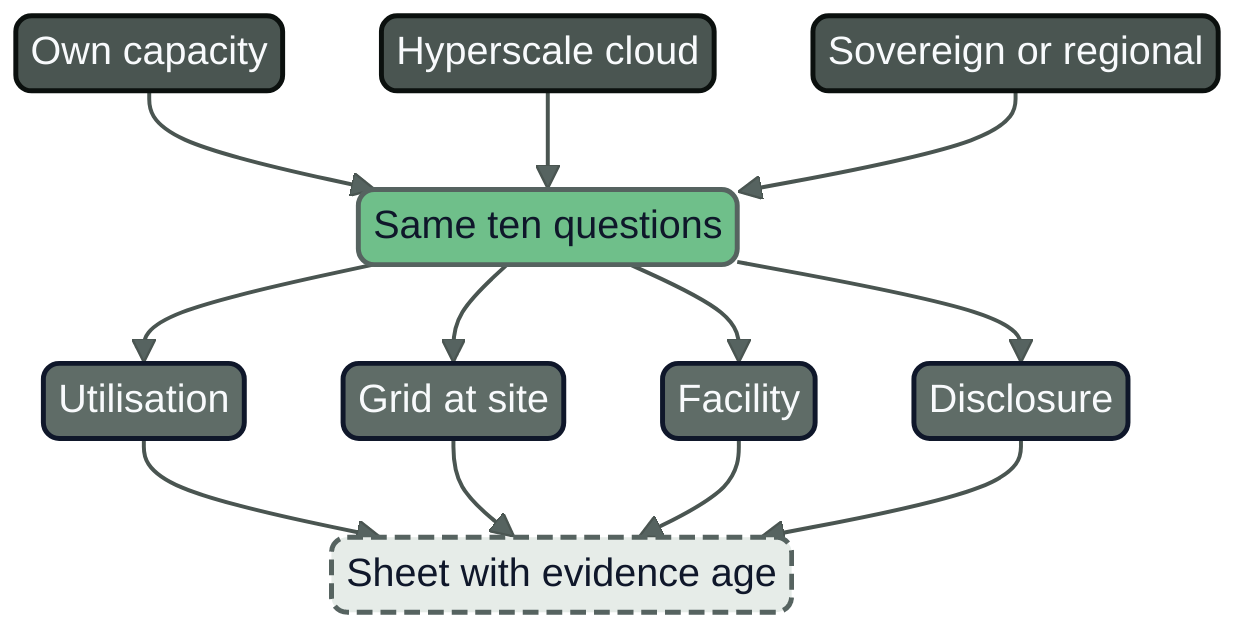
Figure 19.1: Three hosting options compared on the same evidence. The label of the option is not an input; the answers to the same ten questions are, each with its boundary, year and date.
Three options, three claims
Stefan Wiedemann, head of group procurement at Hansa Mutual, receives a one-page paper from Jan Berger, the FinOps lead, on the next block of accelerator capacity for the claims platform. It sets out three options and, under each, one environmental claim. The figures are illustrative, but the form of each claim is familiar from real tenders.
The first option is to extend the group's own Frankfurt capacity. Its claim reads: power usage effectiveness (PUE, the ratio of total facility energy to the energy that reaches the IT equipment) of 1.38, metered at rack level. The second is burst capacity at a hyperscale cloud provider in an EU region. Its claim reads: fleet-wide PUE of 1.15 and 100 per cent renewable electricity, matched annually. The third is a regional provider with a site in the Nordic countries. Its claim reads: renewable energy factor of 100 per cent, PUE of 1.25 at the site, and a grid with a low carbon factor.
Each claim is true as far as it goes, and none can be set against another. The first is a measurement at one site over a year. The second is an average over many sites that includes none of the buyer's, with a market-based, annual renewable share. The third mixes a site figure, a share of purchased electricity and a statement about a grid. None says how busy the accelerators are, what the energy of one claim triaged would be, or how the provider allocates energy to a customer.
The procurement officer's task is not to pick the best claim but to put the same questions to all three, record each answer with its boundary and date, and see which answers are missing.
What the labels settle and what they leave open
The three labels are used loosely in procurement papers, so the chapter fixes them. Hyperscale cloud means the very large public cloud providers, which operate many data centres across regions and sell compute, platforms and model services by use. Sovereign or regional cloud means a provider chosen for its jurisdiction, ownership or location, often smaller and often European; sovereignty is a statement about legal control and residency, not about size, efficiency or grid. Own or colocated capacity means accelerators the organisation owns or reserves in its own halls or in a colocation facility, where it rents space and power and runs the equipment itself.
AI Platform and Security, Chapter 14 adds a second axis that matters here: the consumption model (27, Nordqvist, 2026). An AI feature embedded in a software product, a model reached through an interface, and a self-hosted open-weight model give the buyer very different control. With the first two the buyer usually cannot choose the site, the hardware or the serving stack, so the environmental questions can only be put to the supplier and written into the contract. With a self-hosted model the buyer can choose and measure. That chapter gave a cost rule for self-hosting, an expected average utilisation of at least 40 per cent of an inference node; the environmental counterpart is not a threshold but a measurement of the utilisation the pool actually achieves.
Five quantities carry the environmental difference between options, and the chapter uses them throughout.
- Utilisation is the share of an accelerator's time or capacity that does useful work. An idle accelerator still draws power, so energy per unit of work rises as utilisation falls. The definition and the averaging window must be stated, because a mean over a month and a peak over an hour are different numbers.
- Grid carbon intensity is the grams of carbon dioxide equivalent per kilowatt-hour of the electricity at the site. It is location-based when it reflects the grid that physically supplies the site, and market-based when it reflects the contracts the buyer or the provider holds, such as guarantees of origin or power purchase agreements. The two can differ greatly for the same site and the same hour (Chapters 17 and 22).
- Facility efficiency has three common indicators. PUE is defined above. Water usage effectiveness (WUE) is litres of water per kilowatt-hour of IT energy, and Chapter 7 explains why it must say whether it counts water input or consumption. The renewable energy factor (REF) is the share of the facility's electricity that is renewable, as defined for reporting under Delegated Regulation (EU) 2024/1364 (6, European Commission, 2024).
- Heat reuse is the share of the heat that a facility produces which is delivered to someone who uses it, normally through a district heating network (Chapter 18).
- Allocation is how a provider or a landlord turns facility energy into a figure for one customer or one use. It is a method, and methods differ.
PUE measures overhead around the IT equipment, not what the equipment does: a site can have an excellent PUE and idle accelerators. A low PUE is a good property of a facility and a poor guide to the footprint of a use, which is why Chapter 6 counts per use.
What has been published
The honest state of the evidence is that facilities publish more than uses, vendors publish more than independent bodies, and no one publishes a comparison of the three options at the boundary a buyer needs. Table 19.1 sets out what was found for this chapter, with each figure's boundary and year. The figures were retrieved in November 2026 and are not comparable with one another; the table shows what each source can and cannot support.
Table 19.1: What is published, at what boundary, and by whom. Retrieved November 2026. The rows must not be compared with each other.
| Published figure | Boundary and year | Reported by | What it does not say |
|---|---|---|---|
| Fleet-wide average PUE 1.09; total electricity use up 37% (43, Google, 2026) | Google's own data-centre fleet, annual, 2025 | Vendor; limited assurance of certain metrics | The PUE of the site that runs a given customer's job |
| Group PUE 1.24, WUE 0.34 L/kWh, REF 100% (49, OVHcloud, 2025) | Nine sites and the group, fiscal year 2025 | Vendor | Whether REF is matched annually or by hour; utilisation |
| Average PUE 1.375, WUE 0.22 L/kWh; DC5 PUE 1.25 (50, Scaleway, 2025) | Own and leased sites, calendar year 2024; WUE averaged over four French sites only | Vendor | Energy of AI servers per customer |
| Average reported PUE 1.36; about 1.8% of heat reused (11, European Commission, 2026) | 770 reporting data centres, about 36% of the in-scope estimate, 2024 | Commission analysis of operator-reported data | Any single operator; the AI share |
| Up to 3.3 times more energy efficient than on-premises, Europe, compute-heavy workloads (48, Accenture, 2024) | Simulated on-premises against AWS, operational and embodied, 2024 | Commissioned by a cloud provider | Any real on-premises estate; any independent check |
| GPU utilisation averaged 5% (85, Cast AI, 2026) | Customers' non-optimised Kubernetes clusters, 2026; definition not stated | Vendor that sells optimisation | Anything about cloud against on-premises |
Three observations shape the debate. First, the facility figures are better than the use figures. Under Article 12 of Directive (EU) 2023/1791, owners and operators of data centres with an installed IT power demand of at least 500 kW must publish the information in Annex VII (5, European Union, 2023), and the Commission's report of September 2026 analyses what 770 data centres reported for 2024 (11, European Commission, 2026). The report also says that colocation facilities often struggle to obtain complete operational indicators because the customers control the IT equipment, so a landlord's figure can stop at the meter on the rack.
Second, the customer tools of the large providers do not give the energy of an AI use. AWS allocates the emissions of services that have no dedicated racks to accounts by equivalent revenue, and falls back on economic allocation where physical data are not available (83, AWS, 2025). Google allocates the dynamic power of a machine by CPU usage and its idle power by purchased resources, states that customer data are not third-party verified, makes energy per customer available only to customers in a private preview, and does not mention accelerators in the methodology page that was read (84, Google Cloud, n.d.). Chapter 8 draws the same conclusion. Where a supplier publishes a figure per response, as one model provider does with 1.14 g CO2e and 45 mL of water for the marginal inference of a 400-token response, excluding users' terminals, location-based and reviewed by two consultancies (45, Mistral AI, 2025), the figure can be used with that boundary, but it describes that provider's model and not a choice among hosting options.
Third, the model providers' own documentation duty does not reach inference energy. Article 53(1)(a) of the AI Act requires providers of general-purpose AI models to keep technical documentation containing at least the information in Annex XI, which includes the known or estimated energy consumption of the model, ready for the AI Office and national authorities on request (1, European Union, 2024). The Model Documentation Form of the Code of Practice asks for training energy, and for inference only the benchmarked computation for a described task, and it marks the energy rows for the AI Office and national authorities rather than for downstream providers (74, European Commission, 2025). A deployer has no direct energy duty under the Act. A buyer who wants inference energy at a stated boundary has to write the request into the contract.
The debate
Position A holds that scale and utilisation favour hyperscale cloud, so that an organisation that moves its AI use to a large provider moves it to a more efficient place. Position B holds that a sovereign or regional provider can be chosen on environmental evidence: by the grid at its site, by heat reuse and by a disclosure the buyer can contract for. Position C holds that own or colocated capacity can be chosen on environmental evidence too, because the owner controls utilisation, can meter every watt and can choose the site. None is a recommendation of a supplier.
The case for concern
From the side of positions B and C, the concern about hyperscale cloud is opacity and concentration. The facility figures that hyperscale providers publish are fleet averages, and the customer tools allocate by account and by CPU or revenue, not by accelerator, so a buyer cannot see the energy of its own use (Chapter 8). The renewable claims are mostly market-based. Google's 2026 report states its own boundaries plainly: its hourly carbon-free energy share was about 65 per cent in 2025, against 66 per cent in 2024, its total electricity use grew 37 per cent in 2025, and marketplace granular certificates were not counted in the 2025 figure (43, Google, 2026). A large provider that grows its load by a third in a year can improve its efficiency and still raise its absolute footprint, and the customer dashboard does not show how much of that growth is its own. The Commission makes a related point about the sector: more than 70 per cent of reporting sites match their electricity with renewable supply on an annual basis, much of it through purchase agreements and guarantees of origin that are not necessarily tied to local production or to new capacity (11, European Commission, 2026).
From the side of position A, and often of position C, the concern about sovereign and regional providers is scale and disclosure. A smaller operator has fewer sites to optimise, a smaller engineering team for efficiency work, and often a patchier disclosure. The evidence of one such operator illustrates the range within a single provider: its average PUE in 2024 was 1.375, with the site to which it moved its AI servers (DC5) at 1.25 and its other French sites at 1.39 to 1.45, and its electricity use rose 15.4 per cent and its location-based footprint 46 per cent in a year in which, by its own account, AI activity grew (50, Scaleway, 2025). The sovereign label guarantees none of this, and a workload moved to a sovereign provider for legal reasons may land on a higher-carbon grid.
The concern about owned capacity, from positions A and B, is idle hardware. A cloud provider can pool many customers' demand; an organisation that buys accelerators for its own peak pays for, and powers, the gap between peak and average. A vendor that sells optimisation reports that GPU utilisation averaged 5 per cent across customers' non-optimised Kubernetes clusters in 2026, without a stated definition (85, Cast AI, 2026). It is a vendor figure about a particular population and does not describe owned capacity as such, but it shows how far utilisation can sit below what a plan assumes. A cost study of self-hosting on identical H100 hardware found an effective cost per million output tokens that ranged from 0.21 to 15.25 US dollars depending on load, which is a measurement of cost and not of energy (120, Patil, 2026). Energy per unit of work follows the same logic, because idle power is spent whether or not anyone is served.
Finally, all three positions share a concern with the physical grid. The Swedish transmission operator's connection queue for data centres stood at 8,200 MW on 1 November 2026 (39, Svenska kraftnät, 2026). That is applied-for capacity and not demand, but it shows that the sites with the cleanest grids are those many operators want (Chapter 18).
The case for calm
For position A, the strongest evidence is the facility figures and the mechanism behind them. Google reports a fleet-wide average PUE of 1.09 for 2025 (43, Google, 2026). The Commission's analysis gives an average reported PUE of 1.36 for data centres in the Union in 2024 (11, European Commission, 2026). The boundaries differ, a fleet of one operator against a reporting population of many, but the gap is large enough that the direction is not in doubt. A provider that runs many tenants on one pool can also reach higher utilisation than a single organisation, which is the economic reason the cloud exists. The one head-to-head study found is consistent with this. Accenture, commissioned by AWS, simulated a representative compute-heavy workload (an inference workload on a document-understanding model) on premises and on AWS across four regions with the Software Carbon Intensity method, and reported for Europe that running on AWS was 3.3 times more energy efficient and could reduce the carbon footprint by up to 94 per cent for a lift-and-shift, and by up to 99 per cent when the workload was also optimised; the on-premises side was given carbon-free energy estimated from secondary research (48, Accenture, 2024). Per-prompt disclosure is also a hyperscale strength: Google publishes a median figure for a text prompt of 0.24 Wh at the whole-stack boundary (Chapter 6); no comparable measurement was found for a sovereign, regional or owned estate.
For position B, the strongest evidence is that location dominates, and that some sovereign and regional providers sit on clean grids. Annual flow-traced averages for 2025 were 21.3 g CO2e per kWh in Sweden and 335.4 g in Germany, about sixteen times apart, on the same method (41, Electricity Maps, 2026). Sukprasert and colleagues analysed carbon intensity data from 123 regions for 2020 to 2022 and found Sweden the greenest region at about 16 g per kWh and Europe's average at about 280 g, calculated that migrating all workload to the greenest region would cut the global average intensity by 352 g (96 per cent) if capacity there were unlimited, and found that simple scheduling policies capture most of the available benefit (116, Sukprasert et al., 2024). Some sovereign and regional providers report matching facility figures: in fiscal year 2025 one reported a group PUE of 1.24 and 100 per cent REF (49, OVHcloud, 2025), and another installed its AI servers in a site at PUE 1.25 (50, Scaleway, 2025). Heat reuse is a property of place and ownership, not of scale: the Commission found only 67 reporting data centres delivering any waste heat and about 1.8 per cent of the heat generated reused in the Union in 2024 (11, European Commission, 2026), which leaves a large margin for an operator that can sign a heat-network agreement.
For position C, the strongest evidence is control. An organisation with a steady load can run its own accelerators at high utilisation, measure every watt, choose its site and be audited on all of it, which neither of the other options offers by right. No independent measurement was found that shows owned estates reaching high utilisation, so the evidence for position C is a capability, and Hansa Mutual's own pool at 0.52 shows that capability is not the same as result.
Where the positions meet
Both sides accept the same short list of facts, each with its boundary.
Utilisation matters and is rarely disclosed. Energy per unit of work rises as utilisation falls, on any option. The commissioned study credits cloud pooling, and the vendor survey shows that pools can be empty; neither is independent, so an organisation can learn the size of the effect only by measuring the pool it uses.
The grid at the site often outweighs the label. The spread between Swedish and German annual averages is far larger than the spread between a PUE of 1.09 and a PUE of 1.38, which raises facility energy by 27 per cent for the same IT load. A buyer who knows only the label cannot tell whether a hyperscale site is in a low-carbon region or a sovereign site in a high-carbon one. This is the finding of Chapter 17 applied to hosting; where sovereignty or latency fixes the region, the grid is a given and the other quantities decide.
Facility efficiency is a second-order lever, with a floor. Moving from a PUE of 1.38 to 1.15 saves about 17 per cent of facility energy for the same IT load. That is worth having and is rarely the largest term.
Comparability needs the same boundary. A figure is comparable with another only if the facility or fleet, the period, the location-based or market-based method and the water definition are the same. The EU rating scheme will help. The Commission adopted a Delegated Regulation on 21 September 2026 that sets a common rating scheme for data centres, with labels from 15 August 2027 and classes from A to G on PUE and, separately, on WUE (Table 18.4 in Chapter 18) (15, European Commission, 2026). It is adopted but not yet published in the Official Journal or in force. Labels describe facilities, not uses, so they narrow the first of the buyer's questions and leave the others open.
Sovereignty and environment can both be written into a contract. A requirement of jurisdiction and a requirement of disclosure do not compete. The Data Act's right to switch provider (8, European Union, 2023) and the exit plans of AI Platform and Security, Chapter 14 are the means of moving if the environmental evidence turns against a provider. The Commission's proposal for a Cloud and AI Development Act is a proposal only (10, European Commission, 2026); as read in the research for this book in November 2026, its public procurement criteria concern the European supply chain and not the environment.
No independent comparative evidence was found. This is a finding of the search and not proof of absence; a peer-reviewed comparison at a common boundary, with measured on-premises estates, would change the debate.
What can be done
The recommendations hold whichever position proves right.
- Ask all options the same ten questions (the practical guide below) and record the answers with their boundary and date. A missing answer is a result, and it is recorded as missing.
- Measure the pool you use. For owned capacity, meter at rack level and compute utilisation from the scheduler. For reserved capacity at a provider, ask for the mean utilisation of the reservation and the allocation method. For a service, ask for energy per unit of service at a stated boundary.
- Require facility-level figures with both methods. Ask for PUE and WUE for the site, by year, with the water definition, and for carbon on both location-based and market-based methods, with the instrument type for the latter. Ask for the Annex VII report the operator has already prepared (5, European Union, 2023).
- Write disclosure into the contract. Under Article 67 of Directive 2014/24/EU, a contracting authority may include environmental aspects in the award criteria if they are linked to the subject-matter of the contract, and the criteria must come with specifications that allow the information provided by tenderers to be verified (7, European Union, 2014). Upphandlingsmyndigheten's consultation draft of 29 September 2025 for data-centre services proposes a PUE of at most 1.4 as a basic requirement and 1.3 as an advanced one, renewable electricity backed by cancelled guarantees of origin, and reporting under Delegated Regulation (EU) 2024/1364; it is a draft, it covers cloud services, hosting and colocation, and it contains no criterion specific to AI (89, Upphandlingsmyndigheten, 2025). Chapter 23 returns to clauses.
- Pilot measurement before committing. Run the regional or cloud option for 90 days with metering agreed in advance and compare against the owned option at the same boundary.
- Put a budget and a stop path outside the host. Whatever the option, the use runs under an environmental budget set by a person who is not the agent, measured outside the host (by invoice hours, a gateway counter or a meter), with a stop path outside the system it stops, for example a gateway route that can be switched off. An agent that can provision accelerators on a cloud account can spend resources without a person deciding; Level 4 is never used for provisioning or scaling beyond a budget set by someone else (Chapter 15).
- Record the decision and revisit it. The decision, its evidence and its review date go in an AI Decision Record, and the review follows the evidence age of the disclosures and the contract renewal.
Choosing on evidence
Practical guide: the same ten questions for three options
Purpose. To obtain, from each hosting option, answers at comparable boundaries, and to see which are missing, before the choice is made. These ten questions concern the hosting option as a whole; they are not the ten facility questions of Table 18.7, whose answers feed Q2, Q3, Q4 and Q9 here.
Roles. The procurement officer owns the sheet and holds the supplier disclosure records. The FinOps or GreenOps practitioner prepares it. The sustainability lead reviews it and is not the preparer. The data-centre or energy manager answers for owned capacity. The platform lead supplies the utilisation from the scheduler.
Inputs. The use and its footprint record (Chapter 6), the placement policy (Chapter 17), the supplier disclosure records already held (Chapter 8) and the facility reports (Chapter 18).
Steps.
- Fix the use, the functional unit and the period the answers must cover.
- Send the ten questions to each option, including your own data-centre manager. Q1: which site will run the use, and can it change without notice? Q2: PUE of that site, annual, with the period. Q3: WUE of that site and whether it counts water input or consumption. Q4: the carbon factor of the grid at the site, location-based, and the market-based figure with its instrument. Q5: mean utilisation of the pool the use will occupy, with the window. Q6: how energy is allocated to the customer, and whether it is measured or modelled. Q7: energy per unit of service, at a stated boundary and date. Q8: accelerator generation and age, and the embodied figure if the supplier has one. Q9: heat reuse and the share reused. Q10: who verified the answers, when, and the contract right to a refreshed answer each year.
- Record each answer with its boundary, year and source, and mark each as vendor-reported or independent. Record a refusal as a refusal.
- Compare only answers at the same boundary. Where boundaries differ, leave the cells separate.
- Test sensitivity. Change one unknown at a time and see whether the ranking changes (below).
- Record the decision in an AI Decision Record with the review date.
Artefact. The comparison sheet, built from three supplier disclosure records.
# hosting/comparison-HM-2032-11.yaml (illustrative; answers as received 2032-11-08)
comparison: HCS-HM-2032-11        # a view over three supplier disclosure records
use: FPR-HM-0002                  # claims-triage agent, baseline and burst capacity
prepared_by: jan.berger           # FinOps lead
reviewed_by: verena.lindner       # not the preparer
valid_until: 2033-11-08           # 12 months for a supplier disclosure
rule: "no figure is compared across boundaries; unlike boundaries stay in separate cells"
options:
  - id: SDR-HM-0001               # own Frankfurt capacity, answered by the data-centre manager
    q2_pue:         {value: 1.38, boundary: "site, annual, Sep 2031 to Aug 2032", by: own meter}
    q5_utilisation: {value: 0.52, boundary: "accelerator pool, mean of 90 days", by: scheduler}
    q4_grid:        {location_based_g_per_kwh: 350, market_based: "annual, guarantees of origin"}
    q9_heat_reuse:  {value: 0, note: "connection study open"}
  - id: SDR-HM-0002               # hyperscale burst capacity, Cloud A
    q2_pue:         {value: null, note: "fleet figure offered, site figure declined"}
    q5_utilisation: {value: null, note: "not disclosed; allocation is by account, not by accelerator"}
    q4_grid:        {location_based_g_per_kwh: null, market_based: "annual, customer level, lagged"}
    q9_heat_reuse:  {value: null}
  - id: SDR-HM-0003               # regional provider, Nordic site
    q2_pue:         {value: 1.25, boundary: "site, financial year", by: "Annex VII report, vendor-reported"}
    q5_utilisation: {value: null, note: "will report the mean for our reservation"}
    q4_grid:        {location_based_g_per_kwh: 60, market_based: "100 per cent, guarantees of origin"}
    q9_heat_reuse:  {value: null, note: "heat-network agreement under negotiation"}
# the sheet shows four of the ten questions; the count covers all ten
answered_of_ten: {SDR-HM-0001: 8, SDR-HM-0002: 3, SDR-HM-0003: 6}
The owned option answers eight of ten questions because the organisation controls the data, and it answers them at the least favourable values. The cloud option answers three. The regional provider answers six and offers to answer a seventh. An option that answers fewer questions is not worse for the environment, but the buyer cannot count it, and under the Count rule of Chapter 4 a use whose footprint cannot be counted does not scale.
Worked example: a three-option comparison for Hansa Mutual (illustrative)
Hansa Mutual's next block of capacity, 32 accelerators for the claims platform, can be added to the Frankfurt halls, bought as burst capacity at Cloud A or reserved at a regional provider with a Nordic site. All inputs below are illustrative and are labelled as assumptions. The model computes grams of carbon dioxide equivalent per 1,000 requests at the facility boundary, location-based, assuming an accelerator that draws 30 per cent of its peak power when idle and the remainder in proportion to load.
# hosting/relative_carbon.py (illustrative model; every input is an assumption to replace)
IDLE_FRACTION = 0.30            # share of peak power drawn at zero load (assumed)


def grams_per_1000(util, pue, g_per_kwh, peak_kw=0.65, capacity_rps=10.0):
    """Facility-boundary, location-based grams per 1,000 requests."""
    power_kw = peak_kw * (IDLE_FRACTION + (1 - IDLE_FRACTION) * util)
    requests_per_hour = capacity_rps * util * 3600
    return power_kw * pue / requests_per_hour * 1000 * g_per_kwh


base = grams_per_1000(util=0.52, pue=1.38, g_per_kwh=350)       # A: own Frankfurt
cases = {
    "A own Frankfurt":        dict(util=0.52, pue=1.38, g_per_kwh=350),
    "B hyperscale burst":     dict(util=0.65, pue=1.15, g_per_kwh=300),
    "C regional, Nordic":     dict(util=0.55, pue=1.25, g_per_kwh=60),
    "B at utilisation 0.30":  dict(util=0.30, pue=1.15, g_per_kwh=300),
    "A at utilisation 0.80":  dict(util=0.80, pue=1.38, g_per_kwh=350),
    "A with PUE 1.15":        dict(util=0.52, pue=1.15, g_per_kwh=350),
    "B on the grid of C":     dict(util=0.65, pue=1.15, g_per_kwh=60),
}
for name, c in cases.items():
    print(f"{name:24s} index {100 * grams_per_1000(**c) / base:4.0f}")
Running the script gives the indices of Table 19.2, with the own Frankfurt option as 100.
Table 19.2: A sensitivity run on assumed inputs. The figures are an illustration of how the ranking responds to the unknowns, not data about any supplier. Method: facility-boundary, location-based, per 1,000 requests, own model.
| Case | Index (own Frankfurt = 100) | What changed |
|---|---|---|
| A own Frankfurt | 100 | Baseline: utilisation 0.52, PUE 1.38, 350 g/kWh |
| B hyperscale burst | 65 | Assumed utilisation 0.65, PUE 1.15, 300 g/kWh |
| C regional, Nordic | 15 | Assumed utilisation 0.55, PUE 1.25, 60 g/kWh |
| B at utilisation 0.30 | 95 | Burst used lightly |
| A at utilisation 0.80 | 84 | Own pool made busier |
| A with PUE 1.15 | 83 | Own halls made as efficient as B's fleet |
| B on the grid of C | 13 | Same operator, low-carbon site |
The reading is the book's own, and it is about the structure of the problem and not about the numbers. The grid term moves the index by a factor of five to six and dwarfs the rest. Utilisation moves it by 15 to 45 per cent, enough to take away almost all of the advantage that B was assumed to have: B at a utilisation of 0.30 scores 95 against A's 100. Facility efficiency moves it by about 17 per cent. A on a grid of 60 g/kWh would sit at 17, so that the choice among A, B and C depends more on where the electricity comes from than on who owns the hall. A buyer who learns only the label cannot know any of this, and a buyer who has the ten answers can.
The group's decision, AIDR-1369, recorded on 15 November 2032, follows the evidence and its gaps.
# decisions/AIDR-1369.yaml (illustrative)
id: AIDR-1369
organisation: Hansa Mutual
date: 2032-11-15
decision: >
  Keep the Frankfurt platform as the baseline. Do not add owned capacity before the
  heat-connection study reports and rack metering covers the whole pool. Run a
  90-day measured pilot with the regional provider for the re-scoring batch class.
  Keep Cloud A as burst only, under the monthly cap of EBG-HM-0006.
basis:
  comparison: HCS-HM-2032-11
  evidence_age_days_at_decision: 7
  not_established:
    - "energy of Cloud A burst capacity at site level"
    - "utilisation of the regional provider's pool"
budget_and_stop:
  budget: EBG-HM-0006
  set_by: anja.weiss               # not the agent
  measured_by: "invoice accelerator-hours (jan.berger), outside the agent"
  stop_path: "gateway route to Cloud A switched off at 100 per cent of cap"
  drill_valid_days: 90
review: {at: 2033-02-13, also_on: "change of site, hardware, contract or volume above 1.5x"}
owner: anja.weiss
The record does not say that the regional provider is better. It says what is not established and what would establish it, and it keeps the budget and the stop path outside the system that spends.
Verdict
The verdict is stated by function, with the outlook labelled.
E1 Measure and E4 Operate. Observable: facility figures are published by every kind of operator, at different boundaries, mostly vendor-reported; per-use figures for hosting options are not; customer carbon tools allocate by account and by CPU or revenue, not by accelerator; and no independent comparison of the three hosting options was found, the one head-to-head study being commissioned by a cloud provider and simulated on the on-premises side. The label of an option does not predict its footprint for a use. Expected: from 2027, facility labels under the Commission's rating scheme will make PUE and WUE classes comparable across facilities, once the act is published and in force (the Commission adopted it on 21 September 2026; first labels are due on 15 August 2027). They will not give energy per use. Speculation: the relative efficiency of the three options in 2030 depends on utilisation, grid decarbonisation and pooling practices that this chapter cannot forecast, and no source read for it does.
E2 Justify. The net-benefit principle applies. A move from one option to another is justified as a reduction only if the footprint is counted at the same boundary before and after (Count), the move is compared with staying and with not running the use (Compare), and the use runs under a budget with a stop path outside the host (Cap). A move for sovereignty or resilience is justified on those grounds, and no environmental benefit should be claimed for it without the measurement.
What organisations can influence. The buyer controls the questions, the contract, the pool utilisation of its own capacity, the region where it has a choice and the measurement it requires. It does not control the grid, the provider's pooling or the publication of independent studies. The chapter's advice is to influence what is controllable and to treat the rest as evidence that arrives with a date.
Across the modes and the organisations
Across the usage modes
The parties that can measure, budget and stop are not the same across options and modes. Table 19.3 summarises who can do what, and the Level 4 prohibitions of the book apply to every row.
Table 19.3: Who can measure, budget and stop, by option and usage mode.
| Option and mode | Who can measure | Who can budget | Who can stop, outside the host |
|---|---|---|---|
| Embedded or ambient AI from any supplier (Modes 0 to 2) | Supplier only; the buyer reads a disclosure | Licence owner by seats or quota | Licence owner, by disabling the feature |
| Model reached through an interface on hyperscale or regional cloud (Modes 2 to 4) | Gateway counts the volume; energy is the supplier's figure | The register owner, by tokens and cost | The platform lead, by switching the gateway route |
| Self-hosted on a cloud account (Modes 3 to 5) | Invoice hours and scheduler; site energy by disclosure | The use owner, with finance | The use owner, by revoking the credential that provisions accelerators |
| Own or colocated capacity (Modes 3 to 5) | The data-centre manager, at rack level, and the scheduler | The use owner, by energy | The platform lead, by draining the pool at the scheduler |
Level 4 Autonomous is never used for an agent that provisions or scales accelerators beyond a budget set by someone else, for an action that disables the measurement, the budget or the stop path, or for the publication of an environmental claim about a hosting choice. A scheduling agent may recommend moving a batch job between options within a placement policy at the starting ceilings of Chapter 4; it does not decide the choice of option, and the record of AIDR-1369 names who delegated what.
Nordvik Region and Hansa Mutual
Nordvik Region. The Region's hosting contract NR-2026-031, for 24 reserved accelerators at a Nordic provider with up to 8 more on demand, is due for re-tender during the year, and the Region's own data centre nordvik-dc runs the benefits-triage application and other uses. The three options for the re-tender are a regional cloud framework, a hyperscale offering and a sovereign provider. The Region's profile fixes the facts that matter: the Swedish grid at 32 g CO2e per kWh location-based (illustrative), reserved pool utilisation of 0.58 for the third quarter of 2032 (illustrative), the provider's PUE of 1.21 in reporting year 2031 from the Annex VII report held as SDR-NR-0001, and nordvik-dc at about 1.55 with no heat reuse (illustrative). Two findings follow. First, on a Swedish grid the carbon saved by moving 1 MWh of IT load from a PUE of 1.55 to 1.21 is about 11 kg CO2e (0.34 MWh at 32 g per kWh, illustrative arithmetic), which is small against the effort and the loss of local control, so moving nordvik-dc work out for carbon reasons is not justified; heat reuse, which is zero at baseline, is the larger lever for nordvik-dc (Chapter 18). Second, the larger gap is disclosure: the hosting provider reported facility figures and not the grid mix of the hall or energy per customer, and the hosted large-provider model of the eligibility route gave no site, grid or energy at all (SDR-NR-0002).
Ida Pettersson, the procurement manager, puts the ten questions into tender annex TA-NR-ENV-01 as conditions and as scored award criteria, linked to the subject-matter of the contract under Article 67 of Directive 2014/24/EU (7, European Union, 2014), and the budget EBG-NR-0001 and its stop path, the gateway route switched to the published FAQ page and the phone service, stay with Henrik Dahl and the platform on-call.
The decision is recorded as AIDR-1319 (illustrative, 8 November 2032): no option is chosen or excluded on environmental grounds until the tender answers are in; the evidence age of the answers is 12 months.
Hansa Mutual. The group's choice is described above: the own Frankfurt halls (about 2.8 MW installed IT power, PUE about 1.38, accelerator utilisation 0.52, 350 g CO2e per kWh location-based, all illustrative), burst capacity at Cloud A (up to 64 accelerators on demand, illustrative) and a regional provider. The decision AIDR-1369 keeps Frankfurt as the baseline, makes Cloud A burst-only under the cap of EBG-HM-0006, a budget in invoiced accelerator-hours for all burst use (the triage agent's own limit on burst calls, EBG-HM-0001 of Chapter 15, sits inside it), and starts a measured 90-day pilot with the regional provider. Dr. Verena Lindner records the location-based and the market-based figures side by side, as Chapter 22 requires, and no sentence in the group sustainability statement about hosting is made without a claim record (CLM-HM-*) behind it. The cloud suppliers give customer-level market-based figures that are monthly and lagged, on a partly documented boundary, so the group method starts from instance-hours, as Chapter 8 shows.
Summary
This chapter staged a debate among three positions on where AI should run, chosen on environmental evidence: hyperscale cloud, sovereign or regional cloud, and own or colocated capacity. It concerns E4 Operate, and it applies the Count, Compare and Cap tests of the net-benefit principle to the choice of hosting.
The case for concern about hyperscale cloud is that it is opaque, that its renewable claims are largely market-based and that a provider whose load grows 37 per cent in a year (Google, 2025, vendor-reported) can improve its efficiency and still raise its footprint. The concern about sovereign providers is that they are smaller, less uniformly efficient and variably transparent, and the concern about owned capacity is that it idles. The case for calm is that hyperscale facilities report low PUE and per-prompt figures and that a commissioned simulation credits cloud pooling, that regional providers can sit on clean grids, and that owned capacity can reuse heat and be measured completely. The positions meet on utilisation, the grid at the site, facility efficiency, heat reuse and disclosure, and on the need for a common boundary. No independent comparative evidence of the three options was found.
What can be done is to put the same ten questions to every option, require facility-level figures by both methods, write disclosure into the contract, pilot measurement, keep a budget and a stop path outside the host, and record the decision with its evidence age and review date. For Nordvik Region this means the tender annex and no exclusion by label before the answers are in; for Hansa Mutual it means AIDR-1369, the Frankfurt baseline, a capped burst and a 90-day pilot. Chapter 20 turns to operating AI sustainably day to day, with observability, budgets and stop paths, and Chapter 23 returns to the procurement clauses that carry these questions into contracts.
Sources
- European Parliament and Council of the European Union. Regulation (EU) 2024/1689 laying down harmonised rules on artificial intelligence (Artificial Intelligence Act). Official Journal of the European Union, 12 July 2024. (1, European Union, 2024)
- European Parliament and Council of the European Union. Directive (EU) 2023/1791 on energy efficiency (recast). Official Journal of the European Union, 20 September 2023. (5, European Union, 2023)
- European Commission. Commission Delegated Regulation (EU) 2024/1364 on the first phase of the establishment of a common Union rating scheme for data centres. Official Journal of the European Union, 17 May 2024. (6, European Commission, 2024)
- European Parliament and Council of the European Union. Directive 2014/24/EU on public procurement. Official Journal of the European Union, 28 March 2014. (7, European Union, 2014)
- European Parliament and Council of the European Union. Regulation (EU) 2023/2854 on harmonised rules on fair access to and use of data (Data Act). (8, European Union, 2023)
- European Commission (2026). Proposal for a Cloud and AI Development Act (CADA). COM(2026) 502, 3 June 2026. (10, European Commission, 2026)
- Nordqvist, G. (2026). AI Platform and Security. The Transformed Architecture, Book 3. (27, Nordqvist, 2026)
- Accenture (2024). How moving onto the AWS cloud reduces carbon emissions. Study commissioned by Amazon Web Services, https://sustainability.aboutamazon.com/carbon-reduction-aws.pdf (retrieved November 2026; vendor-commissioned, simulated on-premises baseline). (48, Accenture, 2024)
- Google (2026). 2026 Environmental Report, 30 June 2026, https://sustainability.google/files/google-2026-environmental-report.pdf (retrieved November 2026; vendor-reported). (43, Google, 2026)
- OVHcloud (2025). PUE, WUE, REF values, Fiscal Year 2025, https://www.ovhcloud.com/sites/default/files/external_files/kpis_fy25.pdf (retrieved November 2026; vendor-reported). (49, OVHcloud, 2025)
- Scaleway (2025). Impact Report 2025 (data year 2024), https://www-uploads.scaleway.com/Impact_Report2025_22ee3a8232.pdf (retrieved November 2026; vendor-reported). (50, Scaleway, 2025)
- Mistral AI (2025). Our contribution to a global environmental standard for AI, 22 July 2025, https://mistral.ai/news/our-contribution-to-a-global-environmental-standard-for-ai (retrieved November 2026; vendor-reported, third-party reviewed). (45, Mistral AI, 2025)
- Cast AI (2026). 2026 State of Kubernetes Optimization Report, press release, 21 April 2026, https://cast.ai/press-release/2026-state-of-kubernetes-optimization-report/ (retrieved November 2026; vendor-reported). (85, Cast AI, 2026)
- Sukprasert, T., Souza, A., Bashir, N., Irwin, D. and Shenoy, P. (2024). On the Limitations of Carbon-Aware Temporal and Spatial Workload Shifting in the Cloud. EuroSys '24, arXiv:2306.06502, https://arxiv.org/abs/2306.06502 (retrieved November 2026). (116, Sukprasert et al., 2024)
- Electricity Maps (2026). Electricity Grid Review 2025: Sweden and Germany, https://www.electricitymaps.com/grid-in-review-2025/sweden and https://www.electricitymaps.com/grid-in-review-2025/germany (retrieved November 2026; annual flow-traced means, method not stated as life-cycle). (41, Electricity Maps, 2026)
- Upphandlingsmyndigheten (2025). Förslag till hållbarhetskriterier för datacentertjänster, consultation draft of 29 September 2025 (retrieved November 2026; draft; the agency's later criteria pages are undated and are read in Chapter 23). (89, Upphandlingsmyndigheten, 2025)
- European Commission (2026). Report on the energy efficiency of data centres in the EU, COM(2026) 500 final, 21 September 2026 (retrieved November 2026). (11, European Commission, 2026)
- Patil, C. (2026). Beyond Per-Token Pricing: A Concurrency-Aware Methodology for LLM Infrastructure Cost Estimation. arXiv:2606.11690, June 2026, preprint, https://huggingface.co/papers/2606.11690 (retrieved November 2026; abstract-level figures only). (120, Patil, 2026)
- European Commission (2025). Model Documentation Form, Transparency chapter of the General-Purpose AI Code of Practice, https://ec.europa.eu/newsroom/dae/redirection/document/118118 (retrieved November 2026). (74, European Commission, 2025)
- Amazon Web Services (2025). AWS Customer Carbon Footprint Tool methodology, Model Version 3.0, October 2025, https://sustainability.aboutamazon.com/aws-customer-carbon-footprint-methodology.pdf (retrieved November 2026; vendor-reported). (83, AWS, 2025)
- Google Cloud (n.d.). Carbon Footprint reporting methodology, https://docs.cloud.google.com/carbon-footprint/docs/methodology (retrieved November 2026; vendor-reported). (84, Google Cloud, n.d.)
- Svenska kraftnät (2026). Information om pågående anslutningsärenden, statistics as at 1 November 2026, https://www.svk.se/aktorsportalen/anslut-till-transmissionsnatet/information-om-pagaende-anslutningsarenden/ (retrieved November 2026). (39, Svenska kraftnät, 2026)
- European Commission (2026). Commission Delegated Regulation supplementing Directive (EU) 2023/1791 as regards a common Union rating scheme for data centres, C(2026) 3472 final, 21 September 2026, Council document ST 13444/26 and Annexes (retrieved November 2026; adopted by the Commission, not yet published in the Official Journal). (15, European Commission, 2026)