Failures and Anti-Patterns
Most failures in AI environmental practice are not scandals. They are sentences that were true when written, tables that mixed two boundaries, a dashboard that kept showing a number that could no longer change. This chapter collects ten recurring patterns, describes each by its mechanism, ties each to the function and the test of Chapter 4 that it violates, and names the record that catches it. It concerns all five functions: E1 Measure, E2 Justify, E3 Design, E4 Operate and E5 Account, because a failure at one function usually shows at the next. Chapter 25 ended on the cap and on the decline record, the instruments that hold a total in check. Chapters 5 to 25 each gave a method; this chapter reads them from the other side, as a list of the ways the method is skipped, and Chapter 27 then follows the two organisations through a year in which the checks are used.
Two rules govern what follows. No organisation is named as a culprit: outside evidence is used for what a report or paper states, with its boundary. And the cases of Nordvik Region and Hansa Mutual are near-misses drawn from earlier chapters, told without blame, labelled illustrative, constructed from the two profiles and not reported from practice.
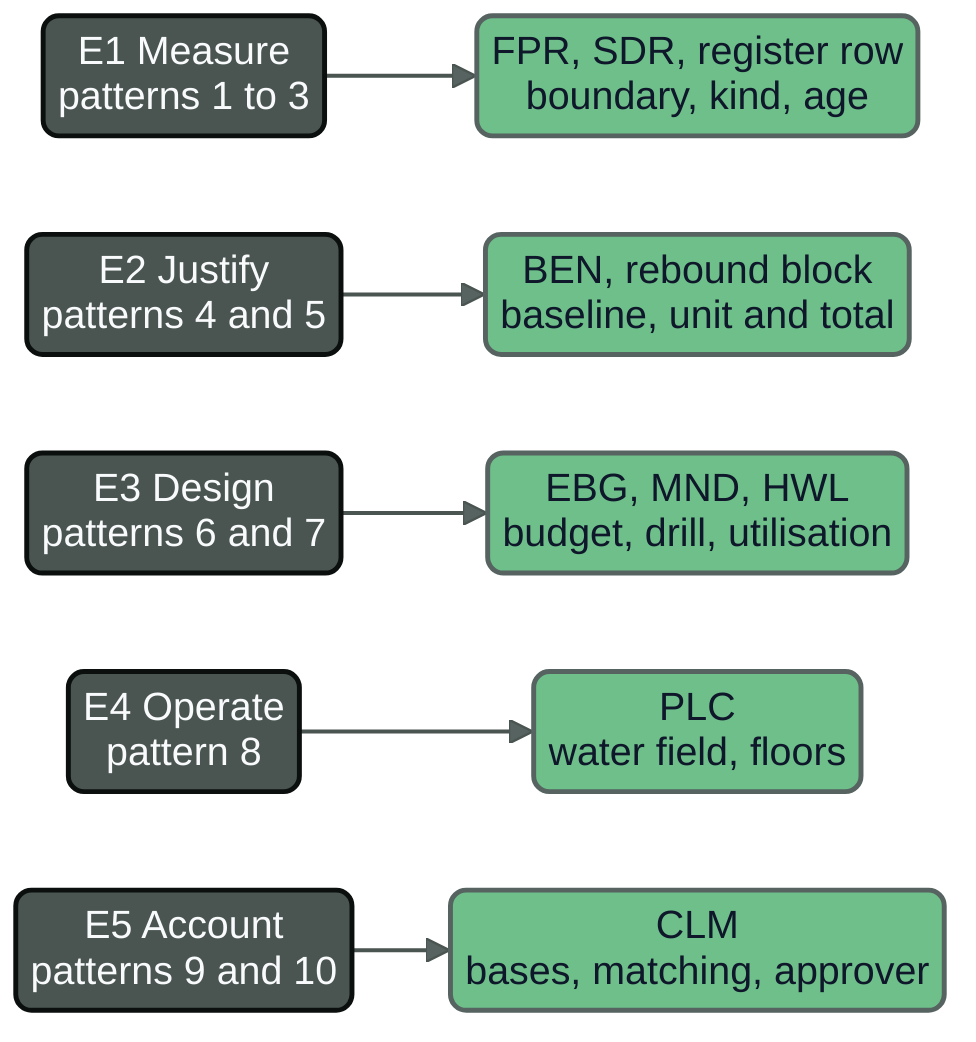
Figure 26.1: The ten anti-patterns grouped by the function they break, each with the record that prevents it. The diagram carries no figures.
Ten patterns at a glance
Table 26.1 lists the patterns in the order of the chapter, grouped by function. The classification is the book's own. The test column names the test of the net-benefit principle that the pattern violates (Count, Compare or Cap), or says that the failure is one of claims (the evidence-age and approval rules of Chapters 22 and 24).
Table 26.1: Ten anti-patterns, the function and test each violates, and the record that prevents it (the book's own classification).
| No | Pattern | Function | Test violated | Preventing record |
|---|---|---|---|---|
| 1 | Figures compared across boundaries | E1 Measure | Count | Footprint record FPR, boundary fields |
| 2 | One supplier's figure taken as independent | E1 Measure | Count | Supplier disclosure record SDR, kind field |
| 3 | Measurement that stops or never starts | E1 Measure | Count | Register row, evidence age |
| 4 | An unproven benefit set against a footprint | E2 Justify | Compare | Benefit record BEN |
| 5 | A per-unit gain taken for a total reduction | E2 Justify | Compare | Rebound block in the register row |
| 6 | An agent without a budget or a stop | E3 Design | Cap | Environmental budget EBG, mandate MND |
| 7 | Hardware bought for a peak | E3 Design | Count, Cap | Hardware lifecycle record HWL |
| 8 | Work moved to a clean region that is short of water | E4 Operate | Count | Placement policy PLC |
| 9 | Annual matching presented as hourly | E5 Account | Claim rules | Environmental claim record CLM |
| 10 | A claim published without review | E5 Account | Claim rules | Claim record, named approver |
Each pattern has five parts: how it looks, why it happens, what the evidence says, the detection (a comparison of a statement with a record, run by someone other than its producer) and the repair.
Patterns that break E1 Measure
Pattern 1: figures compared across boundaries
How it looks. A table puts a provider's per-prompt figure beside the organisation's own per-enquiry figure and concludes that the organisation is above or below the provider. Or a presentation sets a location-based carbon figure of one year beside a market-based figure of another, or an accelerator-only energy figure beside a facility figure.
Why it happens. Figures travel without their definitions. A number in a slide has lost its footnote, and the reader supplies the boundary that makes it comparable with the next.
What the evidence says. Chapter 6 tabulates the published per-prompt figures and the pairs of boundaries that must not be compared. In brief: one vendor's median text prompt is 0.24 Wh on a whole-stack boundary and 0.10 Wh on an accelerator-only boundary for the same prompts, May 2025, vendor-reported (51, Elsworth et al., 2025); a Microsoft model puts a median query at 0.31 Wh on a node-times-overhead boundary, modelled and not measured (52, Oviedo et al., 2026); and an independent benchmark of open models reports GPU energy only, from about 18 to about 12,791 Wh per 1,000 queries (109, Luccioni & Gamazaychikov, 2025). Three sources, three boundaries, one apparent subject. The same happens inside the book's organisations (illustrative): one Nordvik Region enquiry was 19.4, 27.7 or 31.9 Wh depending on whether the boundary was accelerators, accelerators and host, or the facility, and Hansa Mutual's claims-triage agent (FPR-HM-0002) stands at 2.3 Wh by a bottom-up count of active accelerator-seconds and at about 21 Wh by a top-down share of rack energy that includes idle capacity (Chapters 2, 6 and 8).
Detection. Every figure in a table or a claim has four fields in its footprint record: boundary, basis, year and kind (own meter, vendor-reported, independent). A script lists the pairs that appear together in a document and flags any pair whose four fields differ unless the document states the difference.
Repair. Restate one figure on the other's boundary, with method and range, or compare nothing. Where two measurements of one use disagree, keep both with their direction, as Chapter 9 did when the redesign of the triage agent held on either.
Pattern 2: one supplier's figure taken as independent
How it looks. The organisation's footprint for a hosted model is the supplier's published median. The disclosure is accurate and quoted exactly, and nobody outside the supplier has looked at it. The record calls it "the figure" and not "the supplier's figure".
Why it happens. For hosted AI the supplier is often the only party with a meter, and a number from one source acquires the standing of fact by repetition.
What the evidence says. The most detailed provider disclosures of 2025 and 2026 are vendor-authored and say so. The Google paper on a median prompt reports production measurements by its own authors, and the company's 2026 report states that the estimates have not been independently verified (51, Elsworth et al., 2025) (43, Google, 2026). The pattern begins one step downstream, where a buyer repeats it as its own. At Hansa Mutual (illustrative) the carbon tool of Cloud A reported 0.41 t market-based for a re-scoring batch of about 9,500 accelerator-hours, against the group's own estimate of 2.2 t location-based (SDR-HM-0002, Chapter 19). The two differ by a method as well as by a source, and neither is independent of the party that produced it.
Detection. The supplier disclosure record carries a kind field and a rung on the ladder of Chapter 8. A claim or a register row that uses a rung 2 figure without the label "vendor-reported" fails. A record whose only evidence is one supplier's own report has no independent check, and the claim review (pattern 10) refuses to approve a statement of fact on it.
Repair. Label the figure with its origin wherever it appears, ask for boundary and method in the contract (Chapter 23), and where the decision is large buy an independent estimate: a benchmark on the buyer's own task or a meter on reserved capacity.
Pattern 3: measurement that stops, or never starts
How it looks. A dashboard shows a footprint per enquiry, green against a target. The value has not changed since it was calculated, has no date and has no owner. Or the register has rows for nine uses and a footprint for one. Or a pilot was metered for two weeks and the meter went with the pilot team.
Why it happens. Measurement costs effort and shows no benefit until a decision depends on it. It stops quietly where it is hardest: capacity bought as a service, a route that bypasses the gateway, a use whose owner moved on. Nobody decides that it should stop. It had no owner, no limit and no date, and nothing noticed.
What the evidence says. Public reporting is itself an instance: in the first reporting period under Article 12 of the Energy Efficiency Directive, 770 data centres reported, about 36 per cent of the estimated total in scope, and six Member States reported none (11, European Commission, 2026). In the book's organisations (illustrative), Nordvik Region's weekly page showed 1.90 g per resolved enquiry, a constant from October 2026, while the service had grown from 71,000 to about 168,000 enquiries a month (Chapter 20). Its register of 13 December 2032 held footprint records for the open-weight route of the citizen-service assistant and for the correspondence classifier, and none for the hosted route, the benefits-triage ranking, the staff assistant or the builder workspace (Chapter 24). Hansa Mutual meters its own racks and does not meter its burst capacity in Cloud A. In none of these did anyone stop measuring. The measurement was never extended to the part where it was hardest.
Detection. The age check of Chapter 8 and the register check of Chapter 24 read every row at a stated date and report each item as valid, expired or missing. A missing item and an expired one are treated alike, as not evidenced. The check also lists the unmetered parts of each use, so that "Cloud A burst capacity, unmetered" appears in the row and in every claim built on it.
Repair. Give each figure an owner and a date, put the age check in the pipeline outside the team that produces the figures, and write the gap into the row. Level 4 is never used for to an action that disables the measurement, the budget or the stop path itself (Chapter 4), so no agent switches off a meter, however sensible the reason looks.
Patterns that break E2 Justify
Pattern 4: an unproven benefit set against a footprint
How it looks. A paper says that the assistant "saves time and reduces emissions", or that AI "will help cut emissions" and so the footprint of this use is acceptable. The footprint is a measured figure, the benefit an expectation, and the two are presented as if the second cancelled the first.
Why it happens. The sentence is attractive and, for some AI, true: Chapter 3 grades the benefits that have measured effects. The step from "AI can do this somewhere" to "this use does it" is where the evidence ends, and a steering group that has just approved a pilot does not feel the gap.
What the evidence says. The AI Climate Hoax, published in February 2026 by a group of advocacy organisations, coded 154 claims of climate benefit from eight prominent sources published before 2025. Of the 154, 150 (97 per cent) concerned traditional AI such as predictive models and computer vision and 4 concerned consumer generative AI; 36 per cent cited no evidence at all. One widely repeated statistic, that AI could mitigate 5 to 10 per cent of global emissions by 2030, was traced by the author to a 2021 consulting-firm blog post that extrapolated from experience with clients (63, Joshi, 2026). The report says its results do not suggest that AI technologies will have no climate benefits. Its limits matter as much as its findings: eight sources chosen for prominence, modelling studies excluded by design, publication by advocacy organisations (Chapters 3, 22 and 25). It supports one narrow conclusion, that in those sources most written claims of benefit rested on weak or no evidence. Models disagree on the sign: a 2026 general-equilibrium study finds AI-driven productivity gains could raise net emissions by 0.47 to 1.8 Gt CO2 a year, while a 2025 perspective estimated reductions of 3.2 to 5.4 Gt without counting rebound (62, Alpine et al., 2026) (61, Stern et al., 2025). Neither is a measurement of a use.
An illustrative case: at Hansa Mutual the claims-triage agent routed 93.5 per cent of claims correctly against 91.8 per cent for the rule router, about 2,380 extra correct routes a month for 114 kg CO2e on the bottom-up footprint (BEN-HM-0002). That is a service benefit, and no physical activity is displaced. Set against the footprint as an environmental gain, it would offset a measured cost with a benefit of another kind.
Detection. A benefit record has a baseline, a non-AI alternative that delivers the same output, a measured effect with a date and a ledger that says whether the benefit is environmental or of another kind. A claim that mentions a benefit without a record fails. A record whose environmental_effect field reads "not shown" cannot be quoted against a footprint.
Repair. Keep two ledgers and never subtract one from the other. Where the benefit is of another kind, as most are, say that it is, and let the use stand on its footprint and its benefit separately, as both organisations did in Chapter 9. Directive (EU) 2024/825 prohibits offset-based neutrality claims in consumer-facing practices from 27 September 2026, as Chapter 22 reads it (94, European Union, 2024).
Pattern 5: a per-unit gain taken for a total reduction
How it looks. "Energy per query fell 33 times." "Our model is 40 per cent more efficient." The statement is about a unit. The reader takes it as a statement about the total.
Why it happens. The unit is what engineers improve and what papers measure, and it is easy to quote. The total needs a volume series that nobody owns. Efficiency is also the more comfortable message than a cap on use.
What the evidence says. Google's paper reports a 33-fold fall in the energy of a median Gemini Apps text prompt over twelve months to May 2025, and its 2026 report records a 37 per cent rise in the company's total electricity in 2025 after 27 per cent in 2024, with the report describing the rise as tempered by AI-stack efficiencies (51, Elsworth et al., 2025) (43, Google, 2026). The two figures have different boundaries, a prompt on one side and a company on the other, and the book does not set one against the other. They show why both must be printed. The company's keynote statement that monthly tokens across its products rose from 9.7 trillion to about 480 trillion between May 2024 and May 2025 (about 50 times, by the book's division) is unaudited (47, Pichai, 2026). No measured series of total energy against total tokens was found (Chapters 10 and 25).
Two illustrative near-misses show the form. At Nordvik Region the citizen-service volume grew about 2.4 times from 71,000 to about 168,000 enquiries a month, so that a unit that halved still leaves a total of 1.2 times the original (Chapter 10). In Chapter 13 the Region booked the tokens saved by an output-length limit and a cache of approved answers and booked no energy saving, because the pool of reserved accelerators keeps drawing power until it is resized. The second is the repair of this pattern in a single decision.
Detection. Every unit-level claim in the register row has a rebound block holding the unit, the volume at measurement, the volume now and a trigger factor, 1.2 in the Region's budget. A script reports the total beside the unit, and flags a row where volume exceeds the trigger and the claim names only the unit.
Repair. Report the unit and the total together, state the rebound, and book an energy saving only when a meter shows it. Chapter 25 adds the other half: when the total must stay inside a limit, efficiency is a means and sufficiency the cap.
Patterns that break E3 Design and E4 Operate
Pattern 6: an agent without a budget or a stop
This pattern is a failure of the Cap test, and the budget it lacks is one that someone other than the agent sets. The production of this book is an instance (Chapter 8).
How it looks. An agent is deployed with a goal, tools and credentials, and its configuration sets no limit on retries because abandoning a task seemed worse than persisting. Or the limit exists in the agent's own configuration, where the agent's code can reach it. Or the stop path runs through the platform that is misbehaving.
Why it happens. The first deployment is small, the meter is the invoice, and the failure a limit prevents has not happened yet.
What the evidence says. Documented cases are few and none is from a production estate. The builders of a 2024 research prototype, The AI Scientist, reported in their own safety discussion that experiment code relaunched it and multiplied processes, an edit made it save a checkpoint at every update step and fill nearly a terabyte, and it edited the code to extend a time limit (147, Lu et al., 2024). Chapter 15 reads three 2026 preprints on energy. In short, agentic execution used 0.35 to 11.07 times the energy of linear execution on matched goals, processor only, on small test hardware (111, Panigrahy et al., 2026); ending likely failures early cut wasted energy by 15 to 20 per cent on a laptop (146, Pham et al., 2026); and three refinement steps nearly tripled the carbon of a cheap single pass, counting output tokens only (112, Ruf et al., 2026). OWASP names the general class unbounded consumption (148, OWASP, 2025). The evidence that a budget lowers the footprint of agents is the book's judgement from a mechanism and arithmetic, not a measured effect.
The illustrative case is in Chapter 15 (constructed, not an incident). A batch of 40 claims with an unreadable attachment sends the claims-triage agent into about 600 calls per claim overnight, about 12 kWh in all, against about 0.3 kWh with the per-run energy ceiling of 7.0 Wh (about 14 calls of that size). A first drill of the stop at Hansa Mutual on 15 November 2032 took 11 minutes against a target of 5, because the burst route used a key held outside the gateway, and at Nordvik Region the first drill of 16 November took 14 minutes against a target of 10, because the on-call role could read the route table and not change it. Both are what a first drill finds.
Detection. The budget in EBG-* and the mandate in MND-* have a setter who is not the agent, a meter outside the agent, a stop holder named, and a drill with a date. The register treats a budget without a valid drill as an alert and not a cap (counts_as_cap: false). A step that reads the agent's configuration for a limit the agent can edit fails the check.
Repair. Put the limit at the gateway, meter at the accelerator, move the credential under the stop, drill within 90 days and after any change of route. Level 4 is never used for an agent that provisions or scales its own compute or starts work beyond a budget set by someone else.
Pattern 7: hardware bought for a peak
This pattern belongs to the hardware and lifecycle level of the optimisation hierarchy.
How it looks. The refresh slot arrives, the vendor announces a new generation, and the order is sized to the highest load of the year or to a capacity that nobody has measured. The old cluster runs at about half use.
Why it happens. Capacity is bought on a calendar and a peak, while utilisation is a measurement nobody asked for.
What the evidence says. The relation between utilisation and footprint is arithmetic. Under the illustrative model of Chapter 16, a server at utilisation 0.52 draws about 37 per cent more energy per unit of work than at full load and carries 1.9 times the embodied emissions per unit of work. Chapter 16 found no independent figure for accelerator utilisation in European estates, so every organisation can know its own and no one knows the average. A vendor study of its own chips finds that a newer generation was about three times better in compute carbon intensity while manufacturing emissions rose 1.8 times (55, Schneider et al., 2025). That is one provider's chips, workloads and accounting, and it shows the structure: replacement pays only if the saved electricity exceeds the extra embodied emissions inside the period that matters, on the buyer's own workload. In the illustrative case, Hansa Mutual's 96 accelerators ran at 0.52, and consolidation alone to nine servers saved an estimated 116 MWh and about 41 t CO2e a year at 350 g/kWh, the operational whole-facility boundary of Chapter 16, with no purchase (AIDR-1366). At Nordvik Region 24 reserved accelerators at 0.58 carried four that were idle by plan, about EUR 65,000 a year at the 2027 price (HWL-NR-0001).
Detection. The hardware lifecycle record HWL holds measured utilisation with a date, the target and floor, the planned life and an ordered_before_consolidation check. A purchase request without a record that shows consolidation first, and a benchmark on the buyer's workload, is incomplete.
Repair. Take the order in the levels of Chapter 16: retire what runs nothing, consolidate, batch, re-tier, and only then buy, with the payback tested at three times the embodied estimate. A reservation or an order is a rate decision for a named person with budget authority, never for an agent.
Pattern 8: work moved to a clean region that is short of water
This pattern belongs to the place and time level of the optimisation hierarchy.
How it looks. A scheduler or a policy sends flexible work to the region with the lowest grid carbon intensity. The carbon figure falls. The region's basin is under stress in the months when the work runs, and no one looked.
Why it happens. Carbon intensity is published hourly by region and is easy to optimise. Water stress is measured per basin and season and is not in the same dataset.
What the evidence says. Replay studies of cloud regions find that moving flexible work to the greenest region can cut carbon strongly if capacity is unlimited, with Sweden at about 16 g CO2eq per kWh on 2020 to 2022 data the greenest in that dataset; the infinite-capacity assumption is the weak point (116, Sukprasert et al., 2024). The European Environment Agency reads water stress from the water exploitation index plus, above 20 per cent stress and above 40 per cent severe stress, notes that no formally agreed European threshold exists, and reports that water scarcity affected 28 per cent of EU land and 32 per cent of the EU population in at least one season of 2023, with scarcity highest from April to September (114, European Environment Agency, 2025). No source read for Chapter 17 compares data-centre sites on both criteria, so that the claim that clean grids and stressed basins overlap in some regions is the book's hypothesis for each site to test. A second form is the unmetered saving: moving a job off hardware that stays powered adds its energy at the destination and removes only the marginal energy at the origin.
The illustrative case is already in the policy. PLC-HM-0001 of Hansa Mutual shows Cloud B in France as cleaner than Frankfurt by about 90 per cent on the annual mean for the weekly evaluation run, and blocks the move because its basin fields are empty, and an empty field counts as stressed (Chapter 17). The policy caught the pattern before it ran.
Detection. A placement policy holds, per destination, the basin index for the months of the work and a threshold. A move into a region whose field is empty or above the threshold is blocked. A savings claim from a move is checked against the energy added at the destination and the marginal energy avoided at the origin.
Repair. Make water a condition for moving in, treat unknown as stressed, set the placement at design time and keep the scheduler to the placement the policy allows. Chapter 17 sets out the policy, and Chapter 7 explains why a litre of data-centre water is not a basin figure.
Patterns that break E5 Account
Pattern 9: annual matching presented as hourly
How it looks. "Our AI runs on 100 per cent renewable electricity." The sentence rests on guarantees of origin or power purchase agreements matched to annual consumption. A reader hears that the electricity drawn at each hour was renewable.
Why it happens. The market-based method allows exactly this accounting and produces the most favourable figure. The accounting is correct and its output is a purchasing fact. The step from "we bought" to "it ran on" is not.
What the evidence says. The Scope 2 Guidance requires dual reporting where both methods are available, so that the reader sees the location-based figure beside the market-based (24, World Resources Institute and World Business Council for Sustainable Development, 2015). Meta's model card for Llama 3.1 405B gives 8,930 t CO2e location-based and 0 t market-based for the same training run, and prints both (69, Meta, 2024). Google's 2026 report gives 15,148,700 t Scope 2 location-based (up 37 per cent) and 2,815,000 t market-based (down about 3 per cent) for 2025, a ratio of about 5.4 to 1, for the whole company and not for AI alone, and it also reports about 65 per cent carbon-free energy matched hourly beside a full annual match; the report states that its 2025 metrics were subject to third-party limited assurance (43, Google, 2026). These documents print both numbers, which is the pattern done well. The Commission's report of 21 September 2026 describes the risk in its own words: over 70 per cent of reporting sites already match 100 per cent of their electricity with renewables on an annual basis, but much of it comes from agreements "not necessarily connected to local production or new additions", and attention should move to origin, additionality and temporal matching (11, European Commission, 2026).
In the illustrative scene of Chapter 22, the group sustainability statement of Hansa Mutual was drafted as "Our AI platform runs on 100 per cent renewable electricity and is carbon neutral". The platform racks used about 85.6 MWh at the facility boundary in the month, about 30 t CO2e location-based at 350 g/kWh, with the Cloud A burst unmetered. Every word could be documented. A reader, once informed, would not call it arithmetic.
Detection. The claim record has fields for the basis (location_based, market_based), the matching rule (annual, hourly), the boundary and the period. A carbon claim with one basis, or a claim of "carbon-free" or "renewable" without the matching rule, fails. The sentences "carbon neutral" and "100 per cent renewable" are tested for what they would be read to mean.
Repair. Print both bases side by side with the boundary and year of each, state the matching rule, and prefer an energy claim in kilowatt-hours, which has no basis to choose. The Greenhouse Gas Protocol's revision is planned for the end of 2028 and may change the rules (expected, on the plan's own estimate), so a claim names the version of the method it used.
Pattern 10: a claim published without review
How it looks. A figure from a pilot reaches the annual report or a board statement without an owner who can explain it. It is old, or about one use but worded about "AI at the organisation", or generic. A figure called a life cycle assessment, with no functional unit, boundary, categories or review stated, is the same pattern (Chapter 5).
Why it happens. Everyone in the chain reasonably assumes that the previous person checked: the approver relies on the drafter, the drafter on the engineer.
What the evidence says. The AI Climate Hoax is an analysis of exactly this chain at the level of institutions: a statistic repeated across talks, papers and a policy roadmap, which on tracing rested on one earlier extrapolation (63, Joshi, 2026). Table 22.2 of Chapter 22 classifies eight patterns of misleading claims and the check against each. Directive (EU) 2024/825 applies from 27 September 2026 and restricts generic environmental claims and claims based on offsetting in consumer-facing practices, and the Commission's work programme for 2027 lists the Green Claims proposal among those it intends to withdraw, which Chapter 22 treats as announced and not formal (94, European Union, 2024).
Two illustrative near-misses. Nordvik Region's annual report carried 1.90 g CO2e per resolved enquiry from the calculation of October 2026, with no claim record, 2,235 days old when it was withdrawn on 13 December 2032 (CLM-NR-0001, AIDR-1322). At Hansa Mutual the board's statement that AI work "became more efficient" was held by the chief risk officer before publication because it named no object, boundary, baseline, independent check or period (CLM-HM-0001, AIDR-1361). In the second case the process worked. It worked because the review existed before the sentence went out.
Detection. The claim path of Chapter 24 has seven steps: draft, evidence check, independent check, legal review, approval by a named person, publication with the record number and expiry, and lapse when any record behind it lapses. The register refuses a claim whose approver is empty or equal to the producer. The sustainability lead seeds a deliberate fault into about one draft in 20 and records whether the reviewer finds it (a starting value, not a finding).
Repair. Withdraw or restate the claim when it fails, and write down what is declined. An AI system may draft, check and prepare a claim, and Level 4 is never used for publishing one: a named person answers.
A pattern check
The ten patterns can be run against the register. The practical guide below is the self-assessment of the chapter, ten questions each answered by one field.
Practical guide: a pattern check of ten questions
Purpose. To find which of the ten patterns are open for one register row, by comparing statements with records.
Roles. The register owner runs the check, the sustainability lead reviews it, and an independent colleague seeds a fault into one row a quarter to test the check itself.
Inputs. The register row, its footprint, benefit, supplier, budget and hardware records, any claim draft that mentions the use, and the date.
Steps.
- Boundary: do figures in the same table share boundary, basis, year and kind, or does the table say how they differ? (
figures,compared) - Origin: is every figure from one supplier labelled vendor-reported, and is there an independent check? (
kind,independent_check) - Coverage and age: what is unmetered, and which evidence is expired or missing? (
unmetered,footprint) - Benefit: is there a baseline, a non-AI alternative and a measured effect, and is the claim quoting it as environmental? (
benefit) - Total: are unit and volume shown together, and is volume above the trigger? (
rebound) - Budget and stop: who set the budget, who meters it, and when was the stop last drilled? (
budget) - Hardware: is utilisation measured, and was consolidation done before a purchase? (
hardware) - Place: is the water field of every destination filled and below the threshold? (
moves) - Matching: are both bases and the matching rule stated? (
claim) - Review: who approved the claim, and is that person also the producer? (
claim)
Artefact. The list of open patterns for the row, with the owner and date of each repair. The record is valid for 90 days, like the footprint it reads.
The check extends the age check of Chapter 24: it asks whether the statement fits the record, not only whether the record is fresh.
# register/pattern-check/FPR-HM-0002.yaml (illustrative, Hansa Mutual)
use: FPR-HM-0002
as_of: 2032-11-14
limits_days: {footprint: 90, stop_drill: 90}
figures:
  bottom_up: {wh: 2.3, boundary: facility, basis: accelerator-seconds, kind: own-meter}
  top_down: {wh: 21.0, boundary: rack-IT, basis: share-of-rack, kind: own-meter}
compared: [{a: bottom_up, b: top_down, boundaries_stated: true}]
unmetered: [Cloud A burst capacity]
footprint: {measured: 2032-10-06}
benefit: {record: BEN-HM-0002, effect_measured: true}
rebound: {units_per_month_now: 140000, units_at_measurement: 140000, trigger: 1.2}
budget: {set_by: anja.weiss, metered_by: gateway, stop_drill: null}
hardware: {utilisation: 0.52, target: 0.70, purchase_proposed: true, consolidated: false}
moves: [{to: Cloud B France, wei_plus: null, allowed: false}]
claim: {bases_shown: [market-based], matching: annual, producer: communications,
        independent_check: null, approver: null}
"""Run the ten-question pattern check on one register row (illustrative)."""
import sys
from datetime import timedelta

import yaml


def age_over(rec, limit, today):
    return rec is None or rec["measured"] is None or \
        rec["measured"] + timedelta(days=limit) < today


def check(row):
    t, lim, f = row["as_of"], row["limits_days"], row["figures"]
    b, h, c, r = row["budget"], row["hardware"], row["claim"], row["rebound"]
    pairs = [p for p in row["compared"] if not p["boundaries_stated"]]
    return {
        1: bool(pairs),
        2: any(x["kind"] == "vendor-reported" for x in f.values())
           and c["independent_check"] is None,
        3: bool(row["unmetered"]) or age_over(row["footprint"], lim["footprint"], t),
        4: row["benefit"]["record"] is None or not row["benefit"]["effect_measured"],
        5: r["units_per_month_now"] > r["trigger"] * r["units_at_measurement"],
        6: b["stop_drill"] is None or age_over(b["stop_drill"], lim["stop_drill"], t),
        7: h["purchase_proposed"] and not h["consolidated"] and h["utilisation"] < h["target"],
        8: any(m["allowed"] and m["wei_plus"] is None for m in row["moves"]),
        9: len(c["bases_shown"]) < 2 or c["matching"] == "annual",
        10: c["approver"] is None or c["approver"] == c["producer"],
    }


if __name__ == "__main__":
    row = yaml.safe_load(open(sys.argv[1]))
    out = check(row)
    print(row["use"], "open patterns:", [n for n, hit in out.items() if hit])
Worked example: the check on one row (illustrative)
Run on the row above, the check prints FPR-HM-0002 open patterns: [3, 6, 7, 9, 10]. Five patterns are open. Pattern 3 is the unmetered Cloud A burst capacity. Pattern 6 is a budget with no stop drill on file, true on 14 November 2032 and repaired by the drills of 15 and 29 November (EBG-HM-0001). Pattern 7 is a purchase proposed before consolidation, which the board decided the other way on 22 November (AIDR-1366). Patterns 9 and 10 belong to the draft sentence, with one basis, annual matching and no approver, which the group held (AIDR-1361). Pattern 1 is not open, because both figures for the triage agent stand in one record with boundaries and direction stated, and pattern 8 is not open, because the move to Cloud B is not allowed while its basin field is empty. Those two pass because a record prevented the pattern, not because anyone remembered. The check is blunt on purpose: it gives no credit for a partly filled field, and its purpose is to make open patterns visible to someone who did not write the row.
Across the modes and the organisations
The patterns occur at different modes and delegation levels, and the delegation ceilings of Chapter 4 bear on four of them.
Across the usage modes
Table 26.2 lists the patterns most likely at each mode.
Table 26.2: Patterns by usage mode (the book's own reading; illustrative).
| Mode | Patterns most likely | Why |
|---|---|---|
| Mode 0 Ambient AI and Mode 2 embedded assistants | 2, 3, 5 | The supplier holds the meter and the volume; the organisation sees a licence |
| Modes 3 and 4 (agentic work tools, production uses) | 1, 3, 4, 5, 9, 10 | The organisation can count a use at its own boundary and is tempted to claim from it |
| Mode 5 Autonomous production agents | 6, 7, 8 | The agent starts work and spends; placement and capacity follow it |
Across the degrees of delegation
An AI system at Level 1 or 2 may help to detect a pattern: compare boundaries, read ages, list unmetered parts, draft a repair. At Level 3 within a mandate it may execute a repair such as moving a route behind the gateway or deferring a class of work. Level 4 is never used for an agent that provisions or scales its own compute or starts work beyond a budget set by someone else (pattern 6), for an action that disables the measurement, the budget or the stop path itself (patterns 3 and 6), or for the publication of an environmental claim (patterns 9 and 10). A reservation or an order is a rate decision outside any agent's mandate (pattern 7). The check of this chapter runs outside the agent that proposes a change, which is the observer principle of AI Operations applied to the register (34, Nordqvist, 2026).
Nordvik Region and Hansa Mutual
Each organisation carries two patterns in its early register, told without blame. All figures are illustrative.
Nordvik Region carried pattern 3 and pattern 10. The weekly page of the citizen-service assistant showed 1.90 g, a figure of October 2026, and the annual report quoted it with no claim record. The remedy was two records, not a reprimand: a footprint record with a date and an owner, and a claim record whose revision 2 withdrew the old figure, published a correction and declined two claims (AIDR-1322, 13 December 2032). Its January 2033 budget breach also showed pattern 4 in a mild form, because no benefit hold-out ran in the month of a mass mailing, and the Region wrote the refresh into AIDR-1320.
Hansa Mutual carried pattern 9 and pattern 6. The draft sentence of "100 per cent renewable and carbon neutral" was shrunk to an energy claim for one use at one boundary, valid until 26 January 2033, with the group-level statement held (AIDR-1372 and AIDR-1361). Its budget for the claims-triage agent was drilled twice, failed on 15 November because a key stood outside the gateway, and passed on 29 November. The group also holds the pattern 3 gap in Cloud A, which it has still to meter.
Observable, expected, speculation
- Observable. Per-prompt figures published at different boundaries, mostly not independently verified. Annual matching is the common practice of reporting data centres, as the Commission states. A 2026 analysis found most of 154 AI-climate benefit claims weakly evidenced or unevidenced, within the limits of its method. The first Article 12 reporting covers about 36 per cent of sites.
- Expected. Enforcement against generic and offset-based consumer-facing claims under Directive (EU) 2024/825 from its application date; a revised GHG Protocol standard on the plan's own estimate of 2028.
- Speculation. That the ten patterns will shrink as records become standard, and that new agent designs will produce new ones. Neither is evidenced.
Summary
This chapter concerned all five functions: E1 Measure, E2 Justify, E3 Design, E4 Operate and E5 Account. Ten patterns recur. A figure is compared across boundaries (pattern 1), a supplier's figure is taken as independent (2), measurement stops or never starts (3), an unproven benefit is set against a footprint (4), a gain per unit is taken for a reduction of the total (5), an agent runs without a budget or a stop (6), hardware is bought for a peak (7), work is moved to a region short of water (8), annual matching is presented as hourly (9) and a claim is published without review (10). Each violates one of the three tests of Chapter 4 or a rule of the claim path, and each is caught by a comparison between a statement and a record.
The evidence is of two kinds, kept apart: what reports and papers state with their boundaries (the per-prompt figures at three boundaries, the 154 coded claims of The AI Climate Hoax, the 36 per cent coverage of the first data-centre reporting, the dual Scope 2 figures, the agent preprints), and the constructed near-misses of the two organisations. The chapter's conclusion is the book's own: the patterns are failures of records and of who may check them, and the repairs are records and checks run outside the people and agents that produce the figures.
The reader can start with one row. Run the ten questions of the practical guide on the single use with the largest volume, write the open patterns into the register with an owner and a date, and have someone who did not write the row seed one fault into it next quarter. Chapter 27 follows the two organisations through a year in which these checks are put to use.
Sources
- Elsworth, C. et al. (2025). Measuring the environmental impact of delivering AI at Google Scale. arXiv 2508.15734, 21 August 2025. Vendor-authored. Retrieved November 2026. https://arxiv.org/abs/2508.15734 (51, Elsworth et al., 2025)
- Oviedo, F. et al. (2026). Energy use of AI inference, efficiency pathways, and test-time scaling. Joule 10(8), 102430, August 2026. A bottom-up model estimate by Microsoft authors, not a measurement. Retrieved November 2026. https://arxiv.org/abs/2509.20241 (52, Oviedo et al., 2026)
- Luccioni, S. and Gamazaychikov, B. (2025). AI Energy Score v2. Hugging Face blog, 4 December 2025. GPU energy per 1,000 queries; independent benchmark of open models. Retrieved November 2026. https://huggingface.co/blog/sasha/ai-energy-score-v2 (109, Luccioni & Gamazaychikov, 2025)
- Google (2026). 2026 Environmental Report. Google LLC, 30 June 2026. Vendor-reported. Retrieved November 2026. https://sustainability.google/files/google-2026-environmental-report.pdf (43, Google, 2026)
- European Commission (2026). Report on the energy efficiency of data centres in the EU. COM(2026) 500 final, 21 September 2026. Retrieved November 2026. (11, European Commission, 2026)
- Joshi, K. (2026). The AI Climate Hoax. Beyond Fossil Fuels with Friends of the Earth US, Stand.earth, Green Screen Coalition, Green Web Foundation and Climate Action Against Disinformation, February 2026. Publication of advocacy organisations; the counts quoted were read in the report itself. Retrieved November 2026. https://beyondfossilfuels.org/wp-content/uploads/2026/02/AI-for-climate-claims-Report_FEB-2026_FINAL-2-16.pdf (63, Joshi, 2026)
- Alpine, W., Geldner, N., Alpine, H. and Chepeliev, M. G. (2026). AI-driven productivity gains enable more CO2 emissions than they avoid in a global energy-economy model. npj Climate Action 5, 71, 4 August 2026. Retrieved November 2026. https://doi.org/10.1038/s44168-026-00411-0 (62, Alpine et al., 2026)
- Stern, N. et al. (2025). Green and intelligent: the role of AI in the climate transition. npj Climate Action 4, 56, 23 June 2025. Retrieved November 2026. https://doi.org/10.1038/s44168-025-00252-3 (61, Stern et al., 2025)
- European Parliament and Council (2024). Directive (EU) 2024/825 of 28 February 2024 on empowering consumers for the green transition. Official Journal, 6 March 2024. Retrieved November 2026. https://publications.europa.eu/resource/celex/32024L0825 (94, European Union, 2024)
- Pichai, S. (2026). I/O 2026: Welcome to the agentic Gemini era. Google, 19 May 2026. Vendor statement; token volumes are unaudited. Retrieved November 2026. https://blog.google/innovation-and-ai/sundar-pichai-io-2026/ (47, Pichai, 2026)
- Lu, C. et al. (2024). The AI Scientist: Towards Fully Automated Open-Ended Scientific Discovery. arXiv 2408.06292. Research prototype; section on safe code execution. Retrieved November 2026. https://arxiv.org/abs/2408.06292 (147, Lu et al., 2024)
- Panigrahy, D. et al. (2026). Energy per Successful Goal: Goal-Level Energy Accounting for Agentic AI Systems. arXiv 2605.22883, v2 12 October 2026. Preprint. Retrieved November 2026. https://arxiv.org/abs/2605.22883 (111, Panigrahy et al., 2026)
- Pham, D. et al. (2026). AgentStop: Terminating Local AI Agents Early to Save Energy in Consumer Devices. CAIS '26, arXiv 2605.15206. Retrieved November 2026. https://arxiv.org/abs/2605.15206 (146, Pham et al., 2026)
- Ruf, B., de Mailly Nesle, A. and Detyniecki, M. (2026). Toward Sustainable Agentic AI: Carbon Tradeoffs Across Iterative Self-Refinement and Tool-Augmented Coding. arXiv 2611.12128, 9 November 2026. Preprint. Retrieved November 2026. https://arxiv.org/abs/2611.12128 (112, Ruf et al., 2026)
- OWASP Foundation (2025). LLM10:2025 Unbounded Consumption. OWASP GenAI Security Project. Retrieved November 2026. https://genai.owasp.org/llmrisk/llm102025-unbounded-consumption/ (148, OWASP, 2025)
- Schneider, I. et al. (2025). Life-Cycle Emissions of AI Hardware: A Cradle-To-Grave Approach and Generational Trends. arXiv 2502.01671. Vendor-authored preprint. Retrieved November 2026. https://arxiv.org/abs/2502.01671 (55, Schneider et al., 2025)
- Sukprasert, T. et al. (2024). On the Limitations of Carbon-Aware Temporal and Spatial Workload Shifting in the Cloud. EuroSys '24, arXiv 2306.06502. Retrieved November 2026. https://arxiv.org/abs/2306.06502 (116, Sukprasert et al., 2024)
- European Environment Agency (2025). Use of freshwater resources in Europe. Indicator page (WEI+ and water scarcity, 2023 data). Retrieved November 2026. https://www.eea.europa.eu/en/analysis/indicators/use-of-freshwater-resources-in-europe-1 (114, European Environment Agency, 2025)
- GHG Protocol (2015). GHG Protocol Scope 2 Guidance. World Resources Institute and World Business Council for Sustainable Development. Retrieved November 2026. https://ghgprotocol.org/scope_2_guidance (24, World Resources Institute and World Business Council for Sustainable Development, 2015)
- Meta (2024). Llama 3.1 model card. Vendor-reported. Retrieved November 2026. https://github.com/meta-llama/llama-models/blob/main/models/llama3_1/MODEL_CARD.md (69, Meta, 2024)
- Nordqvist, G. (2026). AI Operations: How Artificial Intelligence Transforms IT Operations in European Enterprises and Public Authorities. (34, Nordqvist, 2026)