Is This Use Worth It? Benefit per Footprint, Baselines and the Non-AI Alternative
Chapter 3 graded the evidence on the benefit side of AI and found most of it a potential, an estimate or an assertion; Chapters 5 to 8 taught how to count the footprint of a use. This chapter puts the two sides together for one use at a time and opens Part III. It teaches the second test of the net-benefit principle, Compare, in full, and it belongs to E2 Justify, the function that decides whether a use is worth its footprint. Compare asks for the benefit against the non-AI alternative and against the rebound that the use causes. The chapter defines a benefit per footprint, shows how to set a baseline and choose the alternative, gives a decision rule, and ends in the benefit record BEN, which holds the answer and the date after which it no longer counts (Figure 9.1).
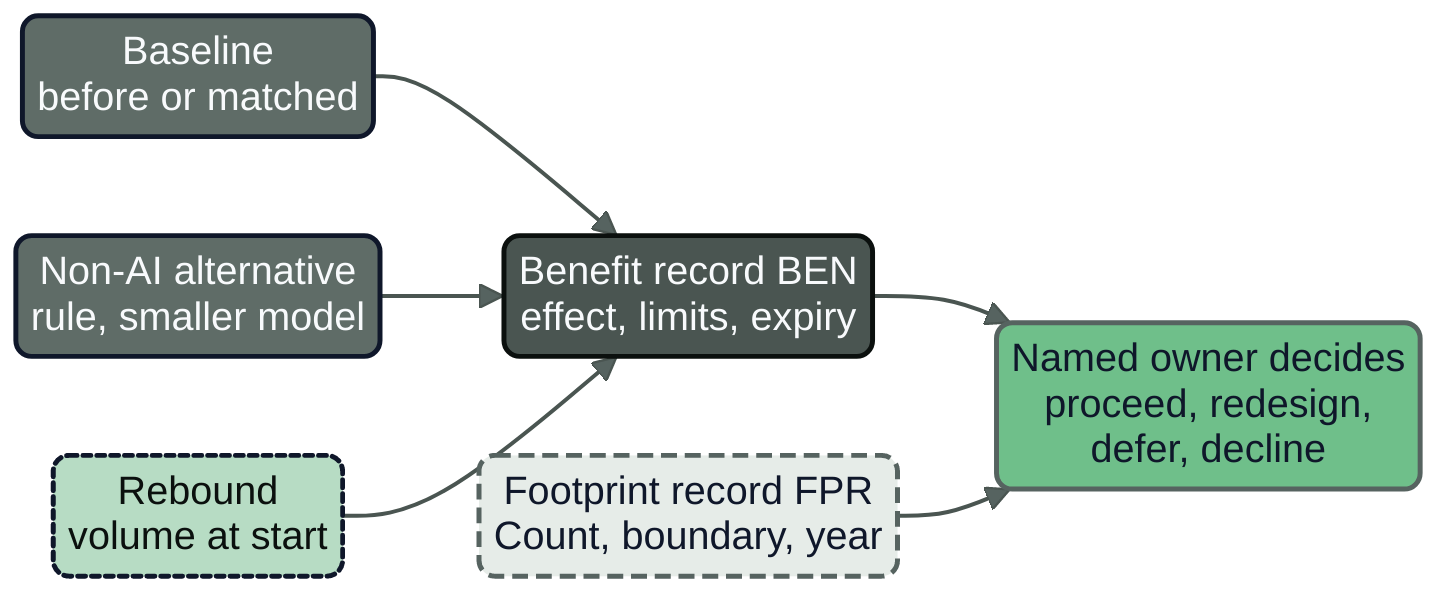
Figure 9.1: Compare means three comparisons. The footprint record answers Count; the benefit record answers Compare; the decision belongs to a named owner and uses both.
A pilot that worked
Imagine a steering group in October 2032. A pilot has run for a season, the users like it, and the project manager presents a slide that says the assistant "saves time and reduces emissions". The first half is supported by a satisfaction survey and a count of enquiries; the second by nothing. Someone asks what the emissions of the assistant itself are, and nobody knows. Someone else asks what they would have been without it, and the question had not come up. The steering group approves the next phase because the pilot worked, and the environmental sentence goes into the draft of the annual report.
The method asks both questions early and in a fixed order: Count first, because a benefit cannot be weighed against a footprint that has not been counted (Chapters 5 to 8); Compare second, the subject of this chapter; Cap third (Chapters 12 to 20).
Compare means three comparisons
The wording of the test, set in Chapter 4, is that the benefit is measured against the non-AI alternative and against the rebound the use causes. Unfolded, it is three comparisons, and a benefit case that skips one of them is incomplete in a specific and recognisable way. Where two things are compared, ITU-T L.1801 asks for the same functional unit on both sides (Chapter 5). The book's own production has no benefit record and offsets nothing (Chapter 8).
- Against the baseline. What happened, or would have happened, to the thing the use is meant to change, when the use was absent? A baseline turns a number into a difference. Without it, a reduction is an observation about a time series.
- Against the non-AI alternative. Which other way of doing the same work was available, and how does it perform on the same unit? The alternative may be doing nothing, a process change, a rule written by a person, a smaller or older model, or a different service. The alternative is the real competitor of the use, and its footprint, which is rarely zero and rarely measured, is part of the comparison.
- Against the rebound. If the use makes the work cheaper, faster or easier, people do more of it, and the extra work has a footprint of its own. The owner states the volume at the start and measures it again. Chapter 10 treats rebound in full; in this chapter it is a field in the benefit record and a reason for an expiry date.
The baseline describes the world without the use; the alternative was a choice open to the organisation, and a pilot with a good baseline may still have ignored the alternative that would have beaten it. The fair comparison of the series is build, buy, reuse, solve without AI and do nothing, each on the same unit of value, period and quality constraints (AI Governance, Chapter 16A) (26, Nordqvist, 2026). This book adds the footprint of each option at the same boundary.
Public buyers are beginning to ask for the same comparison in writing. The French practical sheet for responsible purchasing of AI solutions (November 2025), written for state buyers, tells the buyer to question the interest of an AI solution against non-AI solutions and to make explicit the conditions under which it brings a sufficient benefit (128, MiNumEco, 2025). AFNOR Spec 2314, the French framework for frugal AI, puts its first condition in the same terms: it has been demonstrated that an AI system is necessary (79, AFNOR, 2024). Both are examples of a pattern, not a rule that binds a Swedish region or a German insurer; the page read states no formal legal status for the Spec. Chapter 23 reads what procurement law allows.
Benefit per footprint
A benefit per footprint is a ratio of the effect a use achieves to the footprint it causes, each counted in the same unit of the use, at a stated boundary and for the same period. The unit of the use is the unit of Chapter 6: a resolved enquiry, a claim triaged, a letter drafted. If the use resolves an enquiry for 0.52 g CO2e (Chapter 6, illustrative) and prevents one telephone call in every fourteen or so enquiries, the benefit per footprint is stated as calls avoided per kilogram of CO2e or, which is easier to read and handles a zero benefit, as grams of CO2e per call avoided. The second form is used in this book and is called the footprint per unit of benefit.
Three cases arise, and they must not be confused (Table 9.1).
Table 9.1: The three cases of a benefit per footprint ratio and what each means.
| Case | The benefit is | What the ratio means | What it does not mean |
|---|---|---|---|
| A: environmental, same unit | A quantity of energy, carbon or water avoided, counted at the same boundary as the footprint | A net effect: avoided minus caused | Anything beyond the boundary of both counts |
| B: physical, not yet environmental | An activity avoided (calls, site visits, kilometres) | A price in grams per unit of activity avoided, to be compared with the footprint of that activity | An environmental benefit, until the activity's footprint is counted |
| C: not environmental | Service quality, cost, safety, speed | A ratio of value to footprint | A reduction of the footprint; the two ledgers stay apart |
Case A is rare in practice and is the case that benefit claims usually assume. An organisation that controls the meter of the thing it optimises, such as the cooling of its own data centre, can measure the avoided energy directly. The best-known measured example in the sources of Chapter 3 is of this kind, vendor-reported against a pre-AI baseline in the vendor's own facilities (66, Gasparik et al., 2018). Case B is the commonest in public administration and insurance, where AI displaces a call, a visit or a letter. Case C is commoner still: most uses in the two organisations exist for service quality, speed or cost.
The rule that follows is simple and strict. A case B or case C benefit never enters an environmental claim without conversion, and conversion needs a footprint of the displaced activity counted at the same boundary as the footprint of the use. Until then the benefit is real and the environmental effect is unknown. The record says so in those words.
When only one side is measurable
Often one side of the ratio is known better than the other: the footprint is estimated while the benefit is observed, or the benefit is observed while the footprint of the displaced activity was never measured. Compute the ratio with the ranges of both sides. The program below takes the lowest footprint with the largest effect and the highest footprint with the smallest, so that the result is the widest interval the data allow.
def per_benefit(fp_g, effect):
    """fp_g and effect are (low, central, high); returns g CO2e per unit of benefit."""
    low = fp_g[0] / effect[2]      # smallest footprint, largest effect
    high = fp_g[2] / effect[0]     # largest footprint, smallest effect
    return round(low, 1), round(fp_g[1] / effect[1], 1), round(high, 1)

# Nordvik Region (illustrative): g CO2e per enquiry; calls avoided per enquiry
print(per_benefit((0.19, 0.52, 1.35), (0.05, 0.07, 0.09)))   # (2.1, 7.4, 27.0)
The result, 2.1 to 27.0 g CO2e per call avoided with a central value of 7.4 g, is wide because both inputs are uncertain. It still says what the footprint of an avoided call would have to exceed for the use to be a net saving at this boundary, and that is measurable.
Baselines
A baseline is the record of what happened to the thing the use is meant to change when the use was absent, taken at the same unit, boundary and period as the effect. Four kinds are in use, in rising order of strength, and the benefit record names the kind.
- None. A statement without a comparison. It cannot be wrong and cannot be right, and the benefit record grades it asserted (Chapter 3).
- Before and after. The same assets, people or process before and after the use. It is cheap and exposed to everything else that changed in between: the season, a new timetable, a regulation, a reorganisation. It is acceptable when the effect is large against those changes and the period long enough to include them, and it is graded accordingly.
- A matched or randomised group. Some of the units get the use and others, matched or drawn at random, do not, over the same period. This is the strongest baseline the organisation itself can make. A service rolled out to everyone has no control group, and a hold-out of a share of users for a fortnight is then the cheapest way to create one.
- A counterfactual model. A computed estimate of what would have happened, from a model of the process. It is the baseline of every scenario study. The potential estimates of Chapter 3 are of this kind: the study by Stern and colleagues measures a reduction against a business-as-usual scenario and excludes rebound by construction (61, Stern et al., 2025), and the general-equilibrium study by Alpine and colleagues finds that the sign of the net effect changes when productivity gains in fossil-fuel supply are added to the picture (62, Alpine et al., 2026). A modelled baseline is reasonable to use, and its scenario is part of the claim.
A baseline-free claim can say that a thing happened, not that the use caused it or how much. The critique of 154 climate-benefit claims in eight prominent reports found that 36 per cent of the coded claims cited no evidence and 26 per cent cited published academic papers (63, Joshi, 2026). The report is a publication of advocacy organisations, its sample is small and coded by one author, and it coded evidence type, not baselines.
The comparator must deliver the same output
A baseline or an alternative is a fair comparator only if it delivers the same output. The AI weather forecasts of the European Centre for Medium-Range Weather Forecasts are the instructive case. The centre reports that its AI ensemble system uses about 1,000 times less energy than the physics-based system it is compared with, and runs more than 10 times faster; the comparison is the centre's own estimate, at a coarser resolution (31 km against 9 km), with the initial conditions still taken from the physics-based system (64, European Centre for Medium-Range Weather Forecasts, 2025). An independent comparison of 10 m wind forecasts at more than 9,000 stations from July to November 2025 found the raw physics-based ensemble clearly more accurate at every lead time, although post-processing narrowed the gap (65, Kocsis & Baran, 2026) (a preprint). Both reports can be right: the energy ratio is real for the system compared, and the output differs in resolution and, for some variables, in skill. A ratio computed from the first report alone compares two different products.
The practical rule is to write the output of the comparator and of the use side by side before computing a ratio, and to count a difference in quality as a difference in benefit, in its own ledger.
The non-AI alternative
The alternative to an AI use is rarely the situation before the project. It is the cheapest adequate thing someone could have done instead. Four families cover most cases.
- Do nothing, or stop. The service is not offered, or is offered to fewer people. This is the alternative that the necessity level of the optimisation hierarchy (Chapter 4) starts from, and the one that AFNOR's first condition requires a deployer to have excluded.
- A process change. Fewer forms, a clearer web page, a shorter route to the right desk. These often remove the need for the enquiry that the assistant answers.
- A rule or a classical method. A decision table, a keyword router, a spreadsheet method, an optimisation routine without learning. Rules are transparent and their footprint is usually negligible, which makes them the strongest competitor for any task whose structure is known.
- A smaller or older model. The same technique at a lower cost (Chapter 12): an alternative to be compared on the same unit, not a detail of implementation.
Three rules govern the choice. The alternative is the cheapest one that meets the requirement, not the weakest one that makes the AI look good. Its footprint is counted, or recorded as unknown, at the same boundary as the use; what belongs in the count of a phone call (workstation, telephone system, a share of an office) is a boundary decision the record states. And a benefit that depends on the alternative being poor is not a benefit of the use; if a rule written in an afternoon gives the same result, the use has no case.
A decision rule
The comparison ends in a decision, and the decision belongs to a named person. Four outcomes are available, and the thresholds that separate them are the organisation's own, set before the case is heard and recorded, so that the same case gets the same answer next quarter (Table 9.2).
Table 9.2: The four decision outcomes, the typical condition of each and what happens next.
| Decision | Typical condition | What happens next |
|---|---|---|
| Proceed | A measured benefit against a stated alternative; the footprint is counted and within the organisation's threshold | The use continues or scales, under a budget (Chapters 12 to 20), until the record expires |
| Redesign | The benefit is real but is concentrated in part of the use, or a cheaper alternative delivers most of it | A narrower or lighter variant is built and the case is heard again |
| Defer | The evidence is missing and a cheap measurement could supply it | A measurement is specified with an owner and a date; scale is held until it reports |
| Decline | No benefit over the alternative, or a footprint above the threshold for the benefit shown | The use is not started, or is stopped, and the register records why |
Thresholds belong to the organisation, not the technology: a region answerable to residents and a group reporting under the Corporate Sustainability Reporting Directive will set different ones. They are stated in the units of the records. "The footprint must be reasonable" cannot be applied; "the high end of the footprint range must stay below 250 kg CO2e a month for a use whose benefit is not environmental, and the use is reviewed when volume rises by half" can.
Proportion: when a use is not worth measuring precisely
A measurement is worth its cost only if its result could change the decision: ask which value of the unknown would change the answer, and whether the evidence already available rules that value in or out. If the footprint of a use is small at the high end of its range, the benefit is not environmental and nobody intends to claim it is, the decision does not depend on a more precise footprint, and the owner should record the range, state why precision is not pursued, set the review trigger and move on. A more precise figure becomes worth buying when the use scales, when a claim is to be published, or when the footprint's high end approaches the threshold.
The test guards against two mistakes: a months-long calculation for a use that costs a few kilograms a month, and the approval of a use that costs tonnes because nobody looked. It does not excuse Count: a use whose footprint is unknown has no range, and the record says so (Chapter 6).
Other benefits
Most uses exist for reasons other than the environment, and the reasons are legitimate. The benefit record therefore has separate lines for quality (accuracy, error rate, accessibility), cost (what the use costs and saves) and safety and rights (harm avoided or caused, within the regime that governs the use, such as the high-risk obligations of the AI Act).
Two rules keep the lines honest. The first is that the ledgers are not netted. A saving of cost or an improvement of service never reduces the footprint in the register, and a footprint never cancels a service benefit. The decision weighs them in its own sentence, as a person's judgement; the net-benefit principle forbids using one ledger to hide the other (Chapter 4). The second is that a benefit that is only forecast is not a realised benefit. AI Governance, Chapter 16A warns against counting theoretical time savings as cash and against scaling a use on adoption alone, since high use of a system whose outputs are corrected or ignored is a cost (26, Nordqvist, 2026). The same discipline applies to a vendor's dashboard figure, such as an acceptance rate, which measures activity and is easy to mistake for value (AI Developer, Chapter 20) (36, Nordqvist, 2026).
The benefit record BEN
The benefit record is the artefact of the Compare test, in version control beside the footprint record of the same use. It holds the question it answers: what does this use achieve, against what alternative? Its fields, set in Chapter 4, are the intended benefit, the baseline, the alternative, the measured effect with its limits, the comparison, the rebound, the date and the expiry. This chapter adds the footprint reference, the decision and the thresholds that applied. The identifier follows the footprint record of the same use, as the profile prescribes: BEN-NR-0001 belongs with FPR-NR-0001, BEN-HM-0002 with FPR-HM-0002.
Owner. The owner is the accountable owner of the benefit, not the sponsor alone: where the person who spends the budget also reports its benefit, the spender does not measure the value (AI Leader, Chapter 15) (35, Nordqvist, 2026).
Evidence age. The record carries the date of the measurement and the result of the check, and it expires after 180 days counted from the decision date, not from the measurement (the record is evidence for a decision, so its clock starts when the decision rests on it; the measurement date is kept and may be older), the series' convention for a value claim, or sooner when its conditions change: a new model, a change of route, a volume rise beyond the stated trigger, a change in the alternative. An expired record is marked, not deleted, and a use whose benefit record has expired is a use whose justification has lapsed. A footprint record for a running use expires after 90 days (Chapter 6), so a use usually needs a refreshed footprint twice for each benefit review.
Delegation. An AI system may draft a benefit case and compute its ratios. It does not approve its own case or own the record; a named person decides, and Level 4 Autonomous is never used for the publication of an environmental claim, which passes through the claim record (Chapter 22).
Practical guide: a benefit case in one page
Purpose. Decide whether a use is worth its footprint against the alternative, and leave a record that a person outside the room can challenge.
Roles. The service owner proposes the case; the accountable owner of the benefit signs the measurement; the sustainability lead reads the footprint side and the thresholds; finance checks the cost lines; counsel reviews any statement that will be published.
Inputs. The footprint record of the use (Chapter 6), the volume at the start, the intended benefit in the unit of the use, the candidate alternatives, and the thresholds the organisation has recorded.
Steps.
- State the unit and the benefit. Write the functional unit of the footprint record and the benefit in the same unit. If the benefit is not environmental, write which ledger it belongs to.
- Choose the alternative. Name the cheapest adequate non-AI option and, if it is cheap to try, the smaller-model option. Write what output each delivers.
- Build the baseline. Choose the strongest kind that is affordable: a hold-out group for a fortnight beats a comparison with last year. Write the period, the population and who runs it.
- Measure the effect on both arms with the same instrument, and write the interval, not only the central value.
- Count the footprint on both sides. The footprint of the use comes from its record. The footprint of the alternative is counted at the same boundary, or recorded as unknown with the person who can measure it and the date.
- Compute the footprint per unit of benefit with ranges (the program above), and state in which of the three cases (A, B or C) the benefit falls.
- Record the rebound start. Write the volume at the start and the date of the first recheck; Chapter 10 describes the recheck.
- Decide against the recorded thresholds and write the decision, the person and the review trigger.
- Set the expiry at 180 days from the decision date or at the first change of conditions, and enter the record in the environmental register.
Artefact. One benefit record in version control, one line in the register. Check. A reviewer who has not seen the case can reconstruct the decision from the record and find the footprint record by its identifier.
Two worked decisions (illustrative)
The two decisions follow the profiles in docs/EXAMPLE_ORGANISATIONS.md. Every figure belongs to a fictional organisation and is illustrative; none is data. The footprint figures are those of Chapter 6.
Nordvik Region: the citizen-service assistant
BEN-NR-0001 concerns the open-weight generation route of the citizen-service assistant (SVC-NR-005), the use of FPR-NR-0001. In September 2032 the route resolved about 146,000 enquiries. The footprint record (revision 1) gives 0.52 g CO2e per resolved enquiry, with a range of 0.19 to 1.35 g, at an operational, location-based boundary with embodied impact, water and end-user devices excluded (Chapter 6, illustrative). Over a month that is about 76 kg CO2e, with a range of 28 to 197 kg. The later estimate of Chapter 8 (revision 2, a draft), 0.98 g or about 143 kg a month, lies inside that range, and the decision does not depend on which is used.
The intended benefit is an answer without a telephone call or a wait. The sponsor of the assistant, the Head of IT and Digitalisation, proposes that the benefit be recorded as fewer calls to the service desk. The record's owner is the service desk manager of the regional service centre, outside the sponsor's line, with the finance director holding the cost lines.
The baseline and the alternative. The Region has no control group, because the assistant has been available to everyone for two years. The owner proposes a hold-out. From 2032-10-11 to 2032-10-24, a randomly selected half of the sessions on this route are shown the static FAQ pages and the contact form instead of the assistant, and the service desk counts calls from enquirers within 48 hours. The control arm is the cheapest available non-AI alternative, the page structure the Region had before the assistant. A rule-based search over the same pages is not tried in this round and is recorded as untested.
The measured effect. In the illustrative result, 21 in every 100 enquirers in the control arm telephone the service desk within 48 hours, against 14 in every 100 in the assistant arm: seven fewer calls per hundred enquiries, with an interval of five to nine. At the September volume that is about 10,200 calls avoided a month, with a range of 7,300 to 13,100. A review of 400 sampled answers by caseworkers finds 14 that are materially wrong, 3.5 per cent, and the wrong answers are handled under the AI governance record of the service (AIDR-0014, existing). Quality is recorded as a separate line, and it is not netted against the call reduction.
The comparison. The footprint per unit of benefit is the footprint of the use divided by the calls it avoids: 0.52 g divided by 0.07 per enquiry, or 7.4 g CO2e per call avoided, with a range of 2.1 to 27.0 g. This is a case B benefit. The assistant is a net environmental saving at this boundary only if one handled telephone call has a footprint larger than that, counted at the same boundary: workstation, telephony and a share of the service desk's premises. The Region has never measured that figure. The property and energy manager can read the electricity of the service desk's floor and the call logs, and is asked for a first estimate by 2032-12-15. The record states the unknown, and the Region makes no environmental claim about the assistant.
The cost ledger is separate and, with illustrative inputs, clear. A handled call costs the Region EUR 7.50 in staff time and telephony (finance director's figure, illustrative) and the route costs EUR 0.05 per enquiry through the gateway's showback (illustrative), so the route costs about EUR 7,300 a month and avoids about EUR 76,650 a month of calls, a difference of about EUR 69,000. The record shows the cost line and the footprint line side by side and nets neither.
Rebound. The volume at the start is 146,000 enquiries on the route in September 2032. The service as a whole grew about 2.4 times, from 71,000 resolved enquiries in October 2026 to about 168,000 in September 2032 (profile, illustrative), and the Region does not know how much of that growth is people who would otherwise not have enquired. The first recheck is on 2033-03-31, measuring enquiries per 1,000 residents, and Chapter 10 describes the method.
The decision. Under the thresholds that the Region has recorded (the high end of the footprint range below 250 kg CO2e a month for a use whose benefit is not environmental; review when volume rises by half), the use is within bounds with a high-end footprint of 197 kg. The Head of IT and Digitalisation decides, on 2032-11-08, to proceed, to withhold any environmental claim, to keep the footprint of 76 kg a month in the register at its full value, and to hear the case again when the handled-call estimate arrives or on 2033-05-07, whichever comes first (AIDR-1309). A more precise footprint is not purchased now, because the decision would not change at either end of the range.
# register/ben/BEN-NR-0001.yaml  (illustrative, Nordvik Region)
id: BEN-NR-0001
footprint_record: FPR-NR-0001            # 0.52 g CO2e per resolved enquiry (0.19 to 1.35), 2032-09
use: citizen-service assistant, open-weight generation route
functional_unit: resolved enquiry
owner: service-desk-manager              # outside the sponsor's line
sponsor: henrik.dahl
intended_benefit: {unit: call avoided within 48 hours, ledger: B}
baseline: {kind: randomised hold-out, period: 2032-10-11/2032-10-24, control: static FAQ and form}
alternative: {chosen: static FAQ and form, untested: rule-based search over same pages}
measured_effect:
  calls_per_100_enquiries: {control: 21, assistant: 14, difference: {low: 5, central: 7, high: 9}}
  quality: {sampled: 400, materially_wrong: 14}
  cost_eur_per_month: {use: 7300, calls_avoided: 76650}      # separate ledger, not netted
comparison:
  footprint_g_per_call_avoided: {low: 2.1, central: 7.4, high: 27.0}
  footprint_of_alternative: unknown      # handled call; energy-manager estimate due 2032-12-15
  environmental_effect: not shown
rebound: {volume_at_start: 146000, unit: enquiries per month, recheck: 2033-03-31}
decision: {value: proceed, by: henrik.dahl, date: 2032-11-08, record: AIDR-1309,
           threshold: "footprint high end below 250 kg CO2e per month; review if volume +50%"}
claims_allowed: [service benefit, cost benefit]
claims_withheld: [emissions reduced]
evidence: {measured_on: 2032-10-24, valid_days: 180, expires: 2033-05-07}   # clock from the decision date, 2032-11-08
labels: [illustrative]
Hansa Mutual: the claims-triage agent
BEN-HM-0002 concerns the claims-triage agent (SVC-HM-002, Mode 5), the use of FPR-HM-0002. In September 2032 it triaged about 140,000 claims, with an average of nine model calls per claim. The footprint record gives 0.81 g CO2e per claim, with a range of 0.38 to 1.68 g, and 2.3 Wh per claim, at an operational, location-based boundary with the Cloud A burst capacity unmetered (Chapter 6, illustrative): about 114 kg CO2e a month. That is the bottom-up count of active accelerator-seconds. The top-down attribution of Chapter 8, which includes idle capacity, gives about 1,443 kg a month for the same month, thirteen times more; the decision below does not depend on which is used, because at 1,443 kg the footprint per additional correct route would be about 600 g and the case for the redesign stronger, not weaker. The intended benefit is the right route at registration and a shorter time to first action. The owner of the benefit is the head of claims operations at the Polish service centre, outside the platform team's line, and Anja Weiß, head of the group AI platform, is the sponsor.
The baseline and the alternative. The group already had a rule-based router at registration before the agent. It is the non-AI alternative, and it is still deployed as a fallback. Over eight weeks to 2032-10-31, a sample of 6,000 claims was routed by both, and the handlers' final route in each case was taken as the correct one. The rule router's footprint was not metered. The platform team estimates it at below 0.01 Wh per claim from its processor time, or under 1.4 kWh a month, and marks the figure as an estimate. At 350 g CO2e per kWh that is under half a kilogram a month, against 114 kg for the agent.
The measured effect. In the illustrative result the agent routes 93.5 per cent of claims correctly against 91.8 per cent for the rules, a difference of 1.7 points. The difference is not spread evenly. Of the claims, 62 per cent are structured (a form with coded fields), and there the agent is correct on 97.2 per cent against 97.0 per cent for the rules, which is within the sampling error. The other 38 per cent contain free text, and there the agent is correct on 87.4 per cent against 83.3 per cent, a difference of 4.1 points. A mis-routed claim is re-routed by a handler and loses a median of 1.3 working days (illustrative).
The comparison. This is a case C benefit: it is service quality, and no physical activity with a footprint of its own is displaced. At the whole-use level the agent gives about 2,380 additional correct routes a month for about 114 kg CO2e, which is 48 g per additional correct route (22 to 99 g across the footprint range of 0.38 to 1.68 g, at the central effect; the effect itself has no interval in this example), or about 21 additional correct routes per kilogram. No environmental benefit is claimed, because none is shown, and the footprint stands in the register at its full value. The segment view changes the picture: the structured claims, most of the volume, contribute almost none of the improvement and carry most of the footprint, on the simplifying assumption of the same nine calls per claim in both classes.
The decision. The chief risk officer's governance board, which approves every environmental budget above the group's threshold, hears the case on 2032-11-15. The decision is redesign (AIDR-1359): structured claims go to the rule router, and the agent handles claims with free text. On the same assumption the agent would then triage about 53,200 claims a month and cause about 43 kg CO2e a month, 38 per cent of the present footprint. It would still deliver about 2,180 additional correct routes, so the ratio rises from about 21 to about 50 additional correct routes per kilogram. The redesign is a prediction and not a result. It is tested for 90 days, and the footprint record is refreshed on the redesigned route and on the first change of volume. The change to the agent's mandate is made by a person and recorded; the agent does not alter the routing rules that govern it.
# register/ben/BEN-HM-0002.yaml  (illustrative, Hansa Mutual)
id: BEN-HM-0002
footprint_record: FPR-HM-0002            # 0.81 g CO2e per claim (0.38 to 1.68), 2032-09, Cloud A burst unmetered
use: claims-triage agent (Mode 5)
functional_unit: claim triaged
owner: head-claims-operations-pl         # outside the platform team's line
sponsor: anja.weiss
intended_benefit: {unit: claim routed correctly at registration, ledger: C}
baseline: {kind: paired comparison on audited sample, claims: 6000, period: 2032-09-05/2032-10-31}
alternative: {chosen: rule-based router, footprint_wh_per_claim: "<0.01 (estimate, processor time, not metered)"}
measured_effect:
  correct_route_pct: {agent: 93.5, rules: 91.8}
  by_class: {structured_62pct: {agent: 97.2, rules: 97.0}, free_text_38pct: {agent: 87.4, rules: 83.3}}
  delay_if_misrouted_days_median: 1.3
comparison:
  extra_correct_routes_per_month: 2380
  footprint_g_per_extra_correct_route: {low: 22, central: 48, high: 99}   # footprint range at the central effect
  environmental_effect: not shown        # case C: no physical activity displaced
rebound: {volume_at_start: 140000, unit: claims per month, recheck: 2033-03-31}
decision: {value: redesign, by: annette.kraemer, date: 2032-11-15, record: AIDR-1359,
           change: "rules for structured claims; agent for free text", retest_days: 90}
claims_allowed: [service benefit]
claims_withheld: [AI work became more efficient]   # see CLM-HM-0001
evidence: {measured_on: 2032-10-31, valid_days: 180, expires: 2033-05-14}   # clock from the decision date, 2032-11-15
labels: [illustrative]
The record also bears on the board's statement that AI work at the group "became more efficient" (CLM-HM-0001, Chapter 4). A lower footprint per correct route after the redesign would be an efficiency of one use at one boundary, not proof that the group's AI work became more efficient in total while volumes grew. The claim stays unpublishable until its own fields are filled (Chapter 22).
What the two decisions have in common
Neither decision rests on an environmental benefit, because neither use has shown one. In both, the footprint stays in the register at full value, the benefit stays in its own ledger, and the convenient claim is withheld.
Across the modes and the organisations
Across the degrees of delegation
An AI system can do most of the work of a benefit case and none of its approval. Table 9.3 sets out, by degree of delegation, what a system may do while preparing a benefit case.
Table 9.3: What a system may do in a benefit case, by degree of delegation.
| Degree | What the system may do in a benefit case | Who decides |
|---|---|---|
| Level 0 Advisory | Compute a ratio from records and flag a stale record | A named owner |
| Level 1 Assisted | Draft the benefit record and the comparison table for review | A named owner, after reading the sources |
| Level 2 Supervised | Run the logging for a hold-out and assemble the measurement | A named owner signs the result |
| Level 3 Bounded | Refresh the footprint figures on a schedule inside a mandate | A named owner reviews exceptions; the system alters no threshold |
| Level 4 Autonomous | Never: publishing an environmental claim, altering the thresholds or the measurement of its own benefit, or approving its own case | Not applicable |
A case-preparation agent follows the same budget and stop-path rule as any other agent (Chapter 15). The agent that measures a use is not the agent that runs it, and a system never grades its own benefit.
Across the usage modes
Table 9.4 sets out what the benefit case looks like in each usage mode.
Table 9.4: What the benefit case looks like across the usage modes.
| Mode | What the benefit case looks like |
|---|---|
| Mode 0 Ambient AI | The organisation cannot meter the feature or isolate its effect; a supplier-reported row in the register, with no claim without the supplier's method |
| Modes 1 and 2 | A time saving by a person; not a resource saving until the time displaces something physical |
| Mode 3 Agentic work tool | A baseline per task from the manual route is possible; each task that starts further work has a footprint of its own (Chapter 15) |
| Mode 4 Built AI application | The best-evidenced class: a process with a meter and a non-AI predecessor to compare with |
| Mode 5 Autonomous production agents | Measurable, and the budget and stop path are part of the case; the comparison with a rule-based predecessor is the first thing to try |
Nordvik Region and Hansa Mutual
Nordvik Region. Henrik Dahl sponsors the assistant and owns the register; the service desk manager owns the benefit; Astrid Nyberg reads the footprint side and the thresholds; Pär Lindgren holds the cost lines; Mats Öberg is asked for the first estimate of the footprint of a handled call; Maria Åkesson reviews any statement before publication. The Region proceeds with BEN-NR-0001, withholds the environmental claim and sets the first recheck for 2033-03-31. Because Swedish public-access rules make the Region's records requestable, the benefit record is written so that a resident can read the figures, alternatives and withheld claims together.
Hansa Mutual. Anja Weiß sponsors the agent; the head of claims operations at the Polish service centre owns the benefit; Dr. Verena Lindner reads the footprint and signs the claim record, and Dr. Annette Krämer's board decides. The group redesigns the routing in BEN-HM-0002, keeps the board's efficiency statement unpublished, and tests the redesign for 90 days. The works council's contact (Thomas Brandt) is informed, because the routing change alters the work of the handlers at the service centre, and a per-person measure of handler use is not part of the benefit measurement (BetrVG section 87(1) no. 6 applies before one is switched on).
Observable, expected, speculation
Observable. In the sources read for this book, benefit claims for AI in climate and environment seldom come with a baseline and an alternative: 36 per cent of coded claims in eight prominent reports cited no evidence (63, Joshi, 2026), and the scenario studies leave rebound outside (61, Stern et al., 2025) (62, Alpine et al., 2026). Per-use efficiency is improving quickly while data-centre electricity demand worldwide grew by 17 per cent in 2025 on the International Energy Agency's estimate (38, IEA, 2026). Public buyers in France already ask in writing whether an AI solution is justified against non-AI alternatives (128, MiNumEco, 2025).
Expected. Benefit records with a stated baseline will become part of the governance of AI uses in organisations that already report environmental data, because the reporting duties, the buyers' questionnaires and the claims rules that Chapters 21 to 23 read all ask for the same fields, and because the hold-out measurement is cheap for an organisation that already counts its enquiries.
Speculation. Whether common benefit metrics will be agreed across domains, so that a ratio for a grid forecast and a ratio for a claims router can be compared, is speculation. The units of the two differ, and nothing read for this chapter suggests that a convention is near. The author's own projections are confined to Chapters 25 and 29.
Conclusions
These are the book's own conclusions from the method and the illustrative cases.
- Compare is three comparisons, and a benefit case that omits one has not passed the test.
- A benefit per footprint is an environmental ratio only when the benefit is itself environmental and counted at the footprint's boundary. Most benefits are service, cost or safety and keep their own ledgers.
- The cheapest adequate alternative is the real competitor, and a segment view often shows that the benefit lives in part of the use.
- A measurement is worth buying when its result could change the decision, and the decision is a named person's, against thresholds recorded beforehand.
- Both worked cases pass Count and Compare for service benefits only, and neither claims an environmental benefit. Cap remains for Chapters 12 to 20.
Summary
This chapter taught the second test of the net-benefit principle, Compare, and concerns E2 Justify. It set out three comparisons (baseline, non-AI alternative, rebound), defined the footprint per unit of benefit, separated three cases of benefit and four kinds of baseline, and gave a decision rule with four outcomes.
The benefit record BEN carries the answer and expires after 180 days. In two illustrative decisions, Nordvik Region proceeds with its assistant on a service and cost benefit and withholds an environmental claim because the footprint of a handled call is unmeasured, and Hansa Mutual redesigns its claims-triage agent because the benefit lives in free-text claims. In both, neither side paid for the other.
Chapter 10 takes the third comparison, rebound, and Chapter 11 stages the debate on whether the cost of AI is a crisis or manageable.
Sources
- Nordqvist, G. (2026). AI Governance: Governing Artificial Intelligence in European Enterprises and Public Authorities. The Transformed Architecture, Book 2, published at aig.geon.se. (26, Nordqvist, 2026)
- Nordqvist, G. (2026). AI Developer: How the Developer Role Changes When AI Is Used Broadly in European Enterprises and Public Authorities. The Transformed Architecture, Book 12. (36, Nordqvist, 2026)
- Nordqvist, G. (2026). AI Leader: How Leadership Roles Change When AI Is Used Broadly in European Enterprises and Public Authorities. The Transformed Architecture, Book 11. (35, Nordqvist, 2026)
- Stern, N. et al. (2025). Green and intelligent: the role of AI in the climate transition. npj Climate Action 4, 56. (61, Stern et al., 2025)
- Alpine, W. et al. (2026). AI-driven productivity gains enable more CO2 emissions than they avoid in a global energy-economy model. npj Climate Action 5, 71. (62, Alpine et al., 2026)
- Joshi, K. (2026). The AI Climate Hoax. Beyond Fossil Fuels et al., February 2026. Publication of advocacy organisations. (63, Joshi, 2026)
- European Centre for Medium-Range Weather Forecasts (2025). ECMWF's ensemble AI forecasts become operational. News release, 1 July 2025. Operator-reported. (64, European Centre for Medium-Range Weather Forecasts, 2025)
- Kocsis, M. and Baran, S. (2026). AI and physics-based weather forecasting: A comparative study. arXiv:2606.02508. Preprint. (65, Kocsis & Baran, 2026)
- International Energy Agency (2026). Key Questions on Energy and AI. World Energy Outlook Special Report, April 2026. Independent; modelled and projected figures. (38, IEA, 2026)
- Gasparik, A., Gamble, C. and Gao, J. (2018). Safety-first AI for autonomous data center cooling and industrial control. Google. Vendor-reported. (66, Gasparik et al., 2018)
- AFNOR (2024). AFNOR Spec 2314: General framework for frugal AI. Page read November 2026. (79, AFNOR, 2024)
- MiNumEco (DINUM), Ecolab (CGDD) and Direction des Achats de l'État (2025). Fiche pratique pour l'Achat Responsable de solutions d'Intelligence Artificielle (IA). Version of November 2025, open licence Etalab 2.1. (128, MiNumEco, 2025)