Measuring in Practice: Telemetry, Standards, Supplier Figures and Evidence Age
Chapters 5 to 7 explained what a footprint contains: the model, the use and the water, materials and land behind them. This chapter is about how an enterprise or a public authority gets the numbers. It concerns E1 Measure, the first function of the book's method, and it settles four things for one AI use: which part the organisation can meter itself, which part it must ask the supplier for, which part can only be estimated, and how every figure is kept honest as time passes.
The short answer is that measurement is a system and not a number. A figure enters the system from a meter, a supplier or an estimate, is given a boundary and a date, is checked by something other than the thing that produced it, and is recorded in a footprint record. When it gets too old, or the use changes, it is labelled expired and stops carrying claims. Figure 8.1 shows the chain, which is the Count test of the net-benefit principle (Chapter 4) done so that someone else can inspect it.
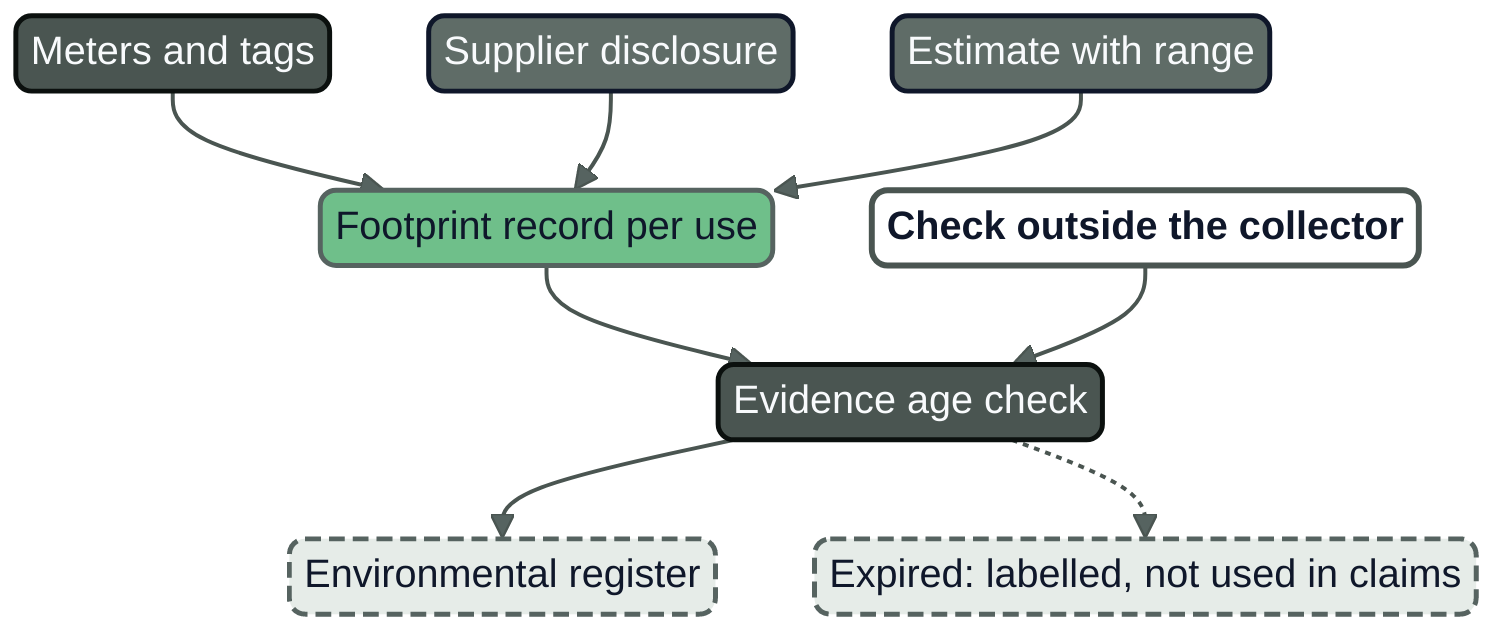
Figure 8.1: A measurement system. Every figure that enters the footprint record carries its boundary and year; a figure that fails the age check or has no independent check is labelled and kept out of claims.
Measurement is a system
An engineer asked how much energy an assistant uses can usually answer with a number in an afternoon. The number is rarely wrong in arithmetic. It is unusable because nobody wrote down what it covered, when it was true and who looked at it besides the engineer. AI Platform and Security, Chapter 22 produced such a number for Nordvik Region's citizen FAQ service (27, Nordqvist, 2026): 1.90 g CO2e per resolved enquiry for October 2026, whose later history is told below.
A measurement system has five parts, each of which can fail on its own.
- Sources. Meters, tags and telemetry the organisation controls; disclosures from suppliers; estimates made from parameters. Each source has a boundary, an owner and an update rhythm.
- Collection. The scripts, gateway exports and requests that move the data. Collection is where gaps appear: a counter that resets, a tag that is missing on one team's resources, a supplier file that arrives two months late.
- Validation. A second source of the same quantity, or a plausibility rule. Accelerator-hours on the provider's invoice and in the gateway's telemetry are two sources of one number; when they disagree by more than a stated tolerance, one of them is wrong.
- Storage. The footprint record in version control, with the data it was computed from, so that a reviewer can recompute it.
- Review. A named person who did not collect the data reads the record and signs it, and a date after which the record stops being evidence.
The fifth part is the observer principle of AI Operations (Chapters 4 and 17) applied to measurement (34, Nordqvist, 2026): what verifies a figure must be independent of what produced it. In AI Purple, Chapter 15 the same idea is the independence principle (33, Nordqvist, 2026). An agent or a script that collects energy data and also reports that the data is complete has verified its own work with its own account. The reviewer, the second source and the supplier's invoice sit outside the collector.
Measurement has a cost, which is a design variable: a footprint record for each of the twelve uses of the two organisations is affordable, a per-request energy meter on every call is not.
What the organisation can measure itself
A buyer's reach depends on who owns the hardware. The layers below run from the outside of the system inwards.
The facility
Where the organisation runs its own data centre, the facility meter is the ground truth for energy. Nordvik Region's nordvik-dc (about 640 kW of installed IT power, annual power usage effectiveness about 1.55, both illustrative) and Hansa Mutual's hansa-dc-frankfurt (about 2.8 MW, about 1.38, illustrative) are above the 500 kW threshold of Article 12 of the Energy Efficiency Directive, so their operators must make the information of Annex VII public each year (5, European Union, 2023). Commission Delegated Regulation (EU) 2024/1364 sets out the information and key performance indicators that operators of such data centres communicate to the European database (6, European Commission, 2024). That is a reporting duty for the facility, at site level and per year. It is a useful input and a poor measure of one AI use, because the facility does not know which watt went to which service.
Power usage effectiveness (PUE) is the ratio of total facility energy to the energy of the IT equipment. A PUE of 1.55 means that for every kilowatt-hour that reaches the servers, another 0.55 goes to cooling, power conversion and the rest of the facility. Water usage effectiveness (WUE) is the corresponding ratio for water. ISO/IEC 30134-9:2022 defines WUE as a key performance indicator of data centres and describes how it is measured, calculated and reported (82, ISO/IEC, 2022). Both are annual or trailing figures, and a buyer who applies a site PUE to a workload assumes that its servers sit at the site average.
The rack and the node
Rack-level power distribution units and node controllers give energy for a group of machines. This is the first layer at which AI energy is separable from the rest of the facility, provided the racks are dedicated to AI work, and it is the layer most often missing: Hansa Mutual meters its Frankfurt GPU racks (illustrative), while Nordvik Region's AI share of nordvik-dc is unmetered at baseline.
The accelerator
An NVIDIA GPU exposes two readings through its management library, NVML. The first reports power in milliwatts for the GPU and its circuitry such as memory; on Ampere (except GA100) and newer GPUs the reading is averaged over one second, on older parts it is instantaneous (87, NVIDIA, 2026). The second reports total energy in millijoules since the driver was last reloaded, on Volta and newer parts. The difference of the energy counter between two timestamps is the energy used in that interval, and it is the better reading for accounting because it integrates the power for the reader. Two limits follow. The counter resets when the driver reloads, so a collector must detect a reset and not subtract across it; and the reading covers the GPU and its circuitry, not the host processor, host memory, network or fans, so it is a lower bound on the energy of the node.
The workload
A rack or a GPU serves many workloads. Kepler, a Cloud Native Computing Foundation project that exports energy metrics at container, pod and node level for Kubernetes, shows the choices an attribution method makes. Its documented model attributes active power to a workload in proportion to its share of node CPU time and does not distribute idle power to workloads. Its GPU attribution is described as experimental: it subtracts an idle baseline from NVML power and divides the remainder among processes in proportion to streaming-multiprocessor utilisation, with equal shares when utilisation data is unavailable (86, Kepler maintainers, n.d.). Two consequences matter to a buyer: an organisation that ignores the idle share reports a lower figure than the facility meter, and attribution by utilisation is a convention that another convention would apply differently to the same joules.
The gateway
For most organisations the best-controlled meter is the AI gateway introduced in AI Platform and Security, Chapter 22 and extended in its Chapter 21 (27, Nordqvist, 2026). It counts requests, tokens, latency, route and use case, and it is outside the model. It does not count energy, but it supplies the two things energy needs: the share of a shared pool that one use consumed, and the denominator of the functional unit. Nordvik Region's gateway already records cost and tokens per use case with weekly showback. Allocation of pool energy to uses by token share is the rule used in the worked example below, and it is a convention that the record names.
Tags and billing
Resource tags that name the use, the owner and the environment make the other layers joinable, so the plan states a coverage target and a check for untagged resources. Billing data is a second, independent source of hours and volume. The FinOps Foundation's sustainability capability advises using whatever data is available even when incomplete, treating AI as a distinct category in sustainability accounting, and drawing on billing data, cloud carbon tools and usage telemetry (88, FinOps Foundation, n.d.). The page is undated guidance on method and contains no measurement of AI.
Utilisation is a measurement, not an assumption
Allocation methods and capacity plans assume a utilisation. A reserved accelerator that is idle still draws power and still carries embodied emissions, so utilisation sets how much footprint each unit of work bears. One vendor, Cast AI, reported on 21 April 2026 that GPU utilisation averaged 5 per cent across the non-optimised Kubernetes clusters it analysed; its release gives no sample size for GPUs, and the vendor sells optimisation (85, Cast AI, 2026). That says nothing about any particular estate, and is a reason to measure one's own: Nordvik Region's reserved pool averaged 0.58 in the third quarter of 2032 and Hansa Mutual's Frankfurt platform 0.52 (both illustrative).
What the provider's tools and reports can tell you
Most organisations buy some AI compute from a cloud or hosting provider, and the provider is the only party that can meter the machines. Three kinds of provider evidence exist, and they answer different questions.
Customer carbon tools. Amazon Web Services' customer carbon footprint tool, in model version 3.0 of October 2025, reports monthly emissions in metric tonnes of CO2e for the previous 38 months by Region and service, with Scope 1, 2 and 3 included. It allocates cluster emissions to racks by power draw and racks to services by usage; for accounts it uses usage-based allocation for services with dedicated racks and economic allocation, that is allocation by equivalent revenue, for services that run on top of other services. Monthly Scope 1 uses unassured activity data and may be underestimated until the next recast (83, AWS, 2025). Google Cloud's carbon footprint reporting splits machine power into dynamic power, allocated by CPU usage, and idle power, allocated by resource allocation of CPU, memory and storage; customers are then charged by usage of each SKU in each region. Google states that the customer reports have not been third-party verified or assured, though the methodology was reviewed, and its documentation does not address GPU workloads (84, Google Cloud, n.d.).
For a buyer the result is limited but clear. These tools give an account-level footprint on the provider's boundary, with a lag. None attributes energy to one AI use, and their allocation keys (revenue, CPU usage) do not drive an accelerator's consumption. A buyer can use them to track the trend of an account and to check the order of magnitude of an estimate, not as the footprint record of a use.
Per-prompt disclosures. Google's study of the Gemini Apps text prompt shows why the boundary comes first: for one service and one month it reports 0.24 Wh per median prompt on a whole-stack boundary and 0.10 Wh on an accelerator-only boundary, a factor of 2.4 apart (51, Elsworth et al., 2025). Both are vendor-reported, and a buyer comparing a whole-stack figure with an accelerator-only one has compared nothing. Chapter 6 treats per-use figures in full (Tables 6.1 and 6.2); the rule for measurement is to record the boundary next to the number, as the footprint record does, and never to place two boundaries in one column.
Standards and methods, and their status
Several standards and specifications address the footprint of AI. Their status differs, and writing "standard" for all of them hides that. Table 8.1 gives what the documents read for this chapter say.
Table 8.1: Standards and methods on the footprint of AI, with their status in November 2026.
| Document | What it is | Status in November 2026 | Use in this book |
|---|---|---|---|
| SCI, ISO/IEC 21031:2024 | Rate: operational plus embodied emissions per functional unit; operational is energy times location-based intensity (21, Green Software Foundation, 2024) | Published as ISO/IEC 21031:2024 | Calculation form for a use the organisation runs |
| SCI for AI, Green Software Foundation | Extends SCI: consumer and provider boundaries; per token and per workflow execution (75, Green Software Foundation, 2026) | Announced ratified 17 December 2025, open for public review (76, Green Software Foundation, 2025); no ISO adoption found | Consumer boundary for a deployer; a specification |
| ISO/IEC TR 20226:2025 | Technical report on life-cycle sustainability aspects and metrics of AI (81, ISO/IEC, 2025) | Published 2025, month not verified; full text paywalled, not read | Reference for aspects, not requirements |
| ISO/IEC 30134-9 | Data-centre indicator for water usage effectiveness (82, ISO/IEC, 2022) | Published 2022; a revision item listed in one catalogue | Reading a facility's WUE |
| AFNOR SPEC 2314 | Frugal AI framework: life-cycle method, 31 guides, claims guidance (79, AFNOR, 2024) | Free "Spec" of 2024, not a standard of the French body | A method a supplier may cite |
| ITU-T L.1801 | Guidelines for assessing the environmental impact of AI systems (78, ITU, 2026) | In force, edition 02/2026; full text not read | Named as an available method |
| prEN 18287:2026, CEN/CENELEC | Requirements for environmental impact evaluation of AI systems and services (77, CEN/CENELEC, 2026) | Draft in public enquiry, 28 October to 23 December 2026; AI Act citation not established | Watch; no contract basis yet |
| GHG Protocol, Scope 3 revision | Revision of the corporate value-chain standard (80, GHG Protocol, 2026) | March 2026 progress update: draft, consultation forthcoming; no AI-specific accounting | Scope 3 stays on the 2011 standard until revised |
Four points arise from Table 8.1.
First, only SCI is an ISO/IEC standard of the group, and it is a small one: a formula and a duty to state boundary and method. It is a rate whose numerator contains only emissions the organisation can reduce, so purchased offsets do not lower the score (AI Platform and Security, Chapter 22). Its energy term includes the energy of hardware reserved for the software, which is why an idle reserved accelerator counts against the score (21, Green Software Foundation, 2024). The intensity term is location-based, which makes SCI a poor tool for a claim built on guarantees of origin and a good one for engineering decisions.
Second, SCI for AI is a specification of the Green Software Foundation whose consumer boundary matches what a deployer controls; the announcement and the repository text word its status differently, so the book calls it a ratified specification and not an ISO standard.
Third, the standards that would carry legal weight are not finished. prEN 18287:2026 is in public enquiry. The AI Act documents a model's energy to the authorities and not to the deployer (Article 53(1)(a) and (5) (1, European Union, 2024); the Model Documentation Form of the Code of Practice marks its energy rows for the AI Office and national authorities (9, European Commission, 2025) (74, European Commission, 2025); Chapter 5 reads both and Chapter 21 treats the provisions). The Act gives a deployer no direct right to a model's energy figures, and providers of free and open-source models without systemic risk are exempt from the Article 53(1)(a) and (b) duties (Article 53(2)), which may cover part of Nordvik Region's open-weight estate. A buyer writes the request into the contract (Chapter 23).
Fourth, the GHG Protocol sets how an organisation counts emissions across its value chain: AI sits in Scope 2 for its own machines and Scope 3 for what it buys. Its March 2026 progress update is a draft, so an organisation that reports AI inside Scope 3 now does so on the 2011 standard with the allocation choices of its own method (Chapter 22).
Estimating when you cannot measure
Some of the most important numbers cannot be metered by the organisation: the energy of a hosted model, the embodied emissions of hardware it does not own, the water used at a supplier's site. An estimate is acceptable on three conditions: the method is stated, the inputs are labelled by kind (metered, vendor-reported, assumed), and the output is a range.
Build from parameters. An estimate for a self-hosted use is accelerator-hours times an assumed average power per accelerator, times the facility factor, times the use's share of the pool. Each factor has a source (hours from the gateway and the invoice, power from the provider's node specification with a range, PUE from the provider's report, share from the gateway), and the low and high come from the widest assumption, not from false precision. The worked example below does this.
Use benchmarks with their boundaries. Public benchmarks give energy per task for particular models on particular hardware. They are inputs to an estimate for a hosted model whose provider does not disclose, and the estimate carries the benchmark's boundary: a GPU-only figure cannot stand in for a whole-system one (Chapters 5 and 6).
Treat billing as a proxy for trend, not for the footprint. Cost correlates with energy within one supplier and price list and fails when prices change or the same cost buys different hardware. Billing is good for volume, hours and the denominator of a functional unit; where it stands in for energy, the record marks it a proxy.
Measure agents by the goal. An agent that makes many calls and retries per task has an energy per task that no per-call figure represents. Panigrahy and colleagues propose Energy per Successful Goal, the total workflow energy including failed attempts divided by the goals completed. Their preprint, on small local hardware, reports that measuring only the processor understates the overhead by about a factor of two for reasoning tasks (111, Panigrahy et al., 2026) (Chapter 6 gives the results). The unit of an agent's footprint is the completed task, and the meter has to include the accelerator. Chapter 15 returns to agents and budgets.
Evidence age
A figure is true of a period. The rule of the book (Chapter 4) is that every figure carries a date and an age limit, and that a figure past its limit is labelled and stops carrying claims. Table 8.2 gives defaults that are this book's illustrative conventions, chosen to match the series; an organisation sets its own and records them in the measurement plan.
Table 8.2: Evidence age by kind of evidence (illustrative conventions).
| Kind of evidence | Valid for | Ends earlier when | When it has expired |
|---|---|---|---|
| Measured footprint of a running use | 90 days | Model, stack, region or hardware changes; volume changes beyond 1.5 times (the plan below) | Marked expired in the register; no claim rests on it |
| Supplier disclosure | 12 months | The supplier changes site, method or contract; a newer annual disclosure appears | Request a new one; the record keeps the old with its date |
| Estimate from parameters | The age of its oldest input | Any input expires | Recompute |
| Benefit evidence | 180 days (Chapter 9) | The population or process changes | Re-measure |
| A public claim | The reporting year it names | The underlying records expire | Withdraw or restate (Chapter 22) |
Age is enforced by a check that reads the records, not by memory. The Python below computes the end of validity of each dated item in a footprint record and reports valid, expired or assumption. Its output is read by someone other than the person who maintains the record.
from datetime import date, timedelta
import yaml

def status(item, today):
    if "valid_days" not in item:
        return "assumption"
    end = date.fromisoformat(str(item["measured_on"])) + timedelta(days=item["valid_days"])
    return "valid" if end >= today else f"expired {(today - end).days} days ago"

def check(path, today=date(2032, 9, 30)):
    rec = yaml.safe_load(open(path))
    return {e["item"]: status(e, today) for e in rec["evidence"]}
The figure that aged
Nordvik Region's 1.90 g CO2e per resolved enquiry is the example. The calculation of October 2026 used 1,970 kWh for GPU servers and host, a PUE of 1.15, a location-based factor of 32 g/kWh, 62,400 g of embodied emissions and 71,000 resolved enquiries (27, Nordqvist, 2026). The operational part is 1.02 g and the embodied part 0.88 g. By the baseline of this book, September 2032, the figure is 2,161 days past the end of the measured period, and against a 90-day limit it expired in January 2027. More has changed than the calendar: volume has grown to about 168,000 enquiries a month, the routes are counted separately, and the reserved pool is shared with the staff assistant. The October 2026 figure remains history and a worked method, nothing else: the register marks it expired, its date stays visible, and the new record states supersedes with that status.
When the supplier cannot say
A supplier that does not disclose is the normal case. The question is what the buyer writes down. The ladder below orders the possibilities from strongest to weakest. A record names the rung it stands on, and a figure at a lower rung does not appear in a total next to figures from a higher one without that being visible.
- Metered by the supplier on a stated boundary, with an independent check. For example, kilowatt-hours for the buyer's reserved pool, from the provider's meter, with the method written in the contract and a right to audit or an assurance statement.
- Reported by the supplier on a stated boundary, without independent check. Vendor-reported, labelled as such. Most annual provider figures sit here.
- Reported on a partial or undefined boundary. The supplier gave a number and could not say what it covers. The record keeps it with the label and does not add it to totals.
- Estimated by the buyer from parameters or benchmarks. The method, inputs and range are in the record. This is the rung of the hosted eligibility-explanation route of Nordvik Region.
- Not measured. The register row says "not measured", names the owner and the date by which a figure is requested, and carries the contract or tender clause that asks for it.
Rungs 4 and 5 must not be dressed as rungs 1 and 2. The remedy for the lower rungs is visibility, not precision: the register and every claim built on it show where the weakest rung is.
The buyer also acts on the gap. A request made once at a contract review is forgotten; a clause in the contract or tender annex has a date. The draft sustainability criteria for data-centre services that the Swedish National Agency for Public Procurement (Upphandlingsmyndigheten) issued for consultation on 29 September 2025 show what such clauses can look like for the facility: a PUE not above 1.4 at the basic level and 1.3 at the advanced level, renewable electricity verified by cancelled guarantees of origin, and reporting of the indicators of Delegated Regulation (EU) 2024/1364. The draft contains no criterion specific to AI workloads, and its final status could not be established (89, Upphandlingsmyndigheten, 2025). The gap between what procurement asks of a facility and what the buyer needs for a use is the content of the supplier disclosure record.
The records
Two records carry the chapter's practice: the footprint record (FPR), the figure of one use, which Chapter 6 introduced as a form, and the supplier disclosure record (SDR), what a supplier gave and did not give. A footprint record is an inventory and not a life cycle assessment; Chapter 5 sets out what an LCA adds.
Practical guide: a measurement plan for one use in one page
Purpose. Fix, before any number is collected, what is counted, from where, by whom, how old it may be and who checks it.
Roles. The use owner (for the citizen-service assistant, the platform lead who owns the gateway), the sustainability lead as reviewer, the procurement manager who holds the supplier record, and the energy manager where the organisation runs its own facility.
Inputs. The service record of the use, the gateway's telemetry, the provider's invoice and disclosure, and the profile's grid factor.
Steps.
- Name the use and its functional unit: a resolved enquiry, a claim triaged, a request answered.
- State the boundary in five words: phase (operation, with embodied separate), energy boundary (facility), carbon basis (location-based), what is excluded, and the year.
- For each data item, name the source, a second source if one exists, and its kind: metered, vendor-reported or assumption. Give an assumption a range.
- Set the age limit for each kind and the events that end validity early.
- Name the independent check, its tolerance and who runs it. The collector never runs it.
- Name the reviewer, who is not the owner, and the date of the first review.
- Set what happens at expiry: the register label, the request to the supplier and the person who is told.
Result. The plan below. It is the artefact; the footprint record is produced from it.
# measurement/plan-fpr-nr-0001.yaml (illustrative)
plan: MPL-NR-0001
use: FPR-NR-0001            # citizen-service assistant, open-weight route
owner: maja-lindqvist       # owns the gateway and its telemetry
reviewer: astrid-nyberg     # sustainability lead, not the owner
functional_unit: resolved enquiry
boundary:
  phase: operation          # embodied carried as a separate, labelled field
  energy: facility          # accelerators, host, idle share, facility overhead
  carbon_basis: location-based
  excluded: [on-demand accelerators, end-user devices, training of the base model]
data:
  - name: accelerator_hours
    source: gateway telemetry
    second_source: provider invoice      # independent source of the same hours
  - name: token_share_of_pool
    source: gateway telemetry
  - name: power_per_accelerator_kw
    source: provider node specification
    kind: assumption                     # not metered; a range is carried
    range: [0.45, 0.62]
  - name: pue
    source: provider Annex VII, reporting year 2031
    kind: vendor-reported
  - name: grid_factor_g_per_kwh
    source: profile value for the Swedish grid
    kind: assumption
evidence_age_days:
  measured_use: 90
  supplier_disclosure: 365
  event_triggers: [model change, region change, volume change above 1.5x]
independent_check:
  method: reconcile accelerator-hours, gateway against invoice; request metered kWh per quarter
  tolerance: 0.05
Worked example: the footprint record for one use (illustrative)
The reserved accelerators of contract NR-2026-031 serve two uses of Nordvik Region, the citizen-service assistant on its open-weight route and the staff assistant (FPR-NR-0003). The pool has 24 reserved accelerators; September 2032 has 720 hours, so the pool has 17,280 accelerator-hours, which the gateway telemetry and the invoice should both show. The provider's node specification gives an average draw per accelerator, with host share, of 0.52 kW at the observed utilisation, with a range of 0.45 to 0.62 kW; the Region has no meter on this number and the record says so. The provider's Annex VII figure for reporting year 2031 gives a PUE of 1.21 (illustrative). The gateway shows that the citizen-service route consumed 41 per cent of the pool's tokens. The Region's profile gives the Swedish grid 32 g CO2e per kWh, location-based.
The arithmetic: 17,280 hours times 0.52 kW is 8,986 kWh at the IT boundary; times 1.21 is 10,873 kWh at the facility boundary; times 0.41 is 4,458 kWh allocated to the citizen-service route; times 32 g/kWh is 142.6 kg CO2e, which over 146,000 resolved enquiries is 0.98 g each (0.85 g to 1.17 g across the power range). This is an estimate from parameters, at the facility boundary, operational phase only, location-based, for September 2032. It excludes the embodied emissions, which the Region allocates by an unsourced rule and carries as a separate field with the status unsourced.
# footprint/FPR-NR-0001.yaml (illustrative figures; draft of September 2032)
id: FPR-NR-0001
revision: 2                       # draft; revision 1 is the estimate of Chapter 6 (0.52 g)
use: citizen-service assistant, open-weight route
period: 2032-09
functional_unit: resolved enquiry
volume: 146000
boundary: operational, facility level, location-based, reserved pool only
energy_kwh:
  it: {central: 8986, low: 7776, high: 10714, kind: estimate}
  facility: {central: 10873, pue: 1.21, pue_kind: vendor-reported}
  allocated_to_use: {central: 4458, share: 0.41, share_basis: gateway tokens}
carbon_g_per_unit: {central: 0.98, low: 0.85, high: 1.17}
embodied: {status: unsourced, included: false}
evidence:
  - {item: accelerator_hours, measured_on: 2032-09-30, source: gateway, valid_days: 90}
  - {item: pue, measured_on: 2032-05-15, source: SDR-NR-0001, valid_days: 365}
  - {item: power_per_accelerator, kind: assumption, source: provider specification}
independent_check:
  status: partial
  done: accelerator-hours gateway vs invoice, within 0.05
  open: metered kWh for the reserved pool requested from the provider
reviewed_by: sustainability-lead
supersedes: {id: SCI-2026-10, g_per_unit: 1.90, period: 2026-10, status: expired}
This is revision 2 of FPR-NR-0001. Revision 1 (Chapter 6) estimated 0.52 g (0.19 to 1.35) for the same month from an assumed draw of 0.30 kW per accelerator and a PUE of 1.15; revision 2 takes the draw from the provider's node specification (0.52 kW), the PUE from its Annex VII figure (1.21) and the pool share from the gateway (0.41 against an assumed 0.40). The boundary is the same, and those three inputs are the whole difference. Revision 2 lies inside the range of revision 1 and stays a draft until the metered kWh arrive; until then the register carries revision 1, and every chapter that quotes the route says which revision it uses.
The record shows what an honest figure looks like: the central value has a range, two inputs are named assumptions, and the independent check is partial. Run at the baseline date, the evidence-age script reports the hours and the PUE as valid and the power per accelerator as an assumption. The Count test is answered only in part, because the embodied emissions are not counted and the check is open, and a claim built on the record would say so.
Supplier records in use
The supplier disclosure record
The supplier disclosure record writes down what the supplier gave, on what boundary and year, and what it did not, and where the buyer went next. Ida Pettersson, procurement manager at Nordvik Region, holds it.
# supplier/SDR-NR-0001.yaml (illustrative)
id: SDR-NR-0001
supplier: European hosting provider, contract NR-2026-031
holder: ida-pettersson
received_on: 2032-05-15
valid_until: 2033-05-15
gave:
  - {item: installed IT power, boundary: site, year: 2031}
  - {item: PUE, boundary: site, year: 2031, kind: vendor-reported}
  - {item: total water input, boundary: site, year: 2031}
did_not_give:
  - energy per customer or per reserved accelerator
  - grid mix of the hall
  - hardware embodied footprint
  - water by customer
fallback_applied: [rung 3, rung 4]
asked_for_next: {at: contract review, vehicle: TA-NR-ENV-01}
The record's date matters as much as its content. The provider reports under Article 12 of the Energy Efficiency Directive each year, so the disclosure received on 15 May 2032 is valid until 15 May 2033. The tender annex TA-NR-ENV-01 is where the missing items become requirements at the re-tender of NR-2026-031. The hosted model behind the eligibility-explanation route (FPR-NR-0002) has a second record, SDR-NR-0002: its provider's site, grid and per-request energy are undisclosed, so the Region's figure can only be a rung 4 estimate from public benchmarks, labelled with their boundary, and until it is made the route stands on rung 5.
Hansa Mutual: its own meters against the cloud tools
Hansa Mutual runs a mixture: its own Frankfurt estate with rack-level meters, burst capacity in Cloud A, hosted models for non-sensitive routes. Its head of group sustainability needs AI inside Scope 2 and Scope 3 by entity, and the claims-triage agent (FPR-HM-0002) is the hard case, because it averages nine model calls per claim and acts through the Polish service centre.
For the part of the agent that runs in Frankfurt, the group attributes the energy of the GPU racks by NVML-based attribution (with the limits described above) and checks the sum against the rack meter. Illustrative figures for September 2032: the metered GPU racks used 49,800 kWh; the attribution gave the triage agent 6 per cent, 2,988 kWh at the IT boundary; at a PUE of 1.38 that is 4,123 kWh at the facility boundary; at the profile's 350 g/kWh, 1,443 kg CO2e, location-based, operational. Divided by 140,000 claims triaged, the figure is 10.3 g CO2e per claim, or 21 Wh at the IT boundary and about 2.4 Wh per model call. Those are estimates, and they are top-down figures: the share is energy of the racks that serve the agent, idle time of those accelerators included. Chapter 6 counted the same month bottom-up, from active accelerator-seconds only, and reached 2.3 Wh per claim at the facility boundary and 0.81 g CO2e. The two differ by about 13 times in carbon because they do not count the same thing, and the record carries both with their direction. The gap is a finding and not a rounding. The likely cause, not measured, is held-open capacity charged to the agent, and Chapter 16 returns to utilisation. The record states that the unmetered Cloud A burst share is not included and that the unit is the claim triaged, retries included.
For Cloud A the group has a monthly carbon-tool report, market-based, with a lag and a partly documented boundary. To test the tool, Hansa Mutual ran a re-scoring batch of claims on Cloud A for a month, counted about 9,500 accelerator-hours from its own billing export, and estimated energy and location-based carbon by the parameter method used in Frankfurt (an assumed 0.6 kW per accelerator, a PUE of 1.3, a regional factor of 300 g/kWh).
Table 8.3: Two figures for the same Cloud A batch month (illustrative). They differ in basis and boundary and are never merged.
| Figure for the same month (illustrative) | Boundary | Basis | Kind |
|---|---|---|---|
| Carbon-tool report for the batch account: 0.41 t CO2e | Cloud A's boundary, account level, allocated by usage metrics | Market-based | Vendor-reported |
| Own estimate from accelerator-hours: 2.2 t CO2e | Facility boundary, operational, with an assumed regional factor | Location-based | Estimate |
The two figures in Table 8.3 do not contradict each other and cannot be compared: one is market-based and one location-based, and the tool's allocation does not follow accelerator activity. Hansa Mutual keeps both columns. The finding is that the tool's figure cannot stand in for the AI use in the group's Scope 3 figure, so the group's method starts from instance-hours and an explicit factor and uses the tool's output as a market-based cross-check of the account's total. That is a design decision of the group and a conclusion of this chapter, not a requirement of any standard read here.
Across the modes and the organisations
Across the usage modes
Who can measure depends on the usage mode more than on the model (Table 8.4), and the party that can meter is often not the party that must report.
Table 8.4: What an organisation can measure itself and what it must ask for, by usage mode.
| Mode | What the organisation can measure itself | What it must ask the supplier for |
|---|---|---|
| Mode 0 Ambient AI | Nothing about the AI; the host product's licence and usage | Any figure at all; usually none exists |
| Mode 1 Conversational assistants | Seats, sessions and tokens where the organisation holds the account | Energy and carbon of the service, on a stated boundary |
| Mode 2 Embedded workplace assistants | Seats and feature usage from the admin console | The footprint of the embedded feature, separated from the host product |
| Mode 3 Agentic work tools | Usage logs and tokens; energy of locally run agents with accelerator and host meters, per goal | The footprint of hosted inference per task |
| Mode 4 Built AI applications | Everything at the gateway; energy of owned hardware at rack and accelerator level | Facility and accelerator figures where the hardware is hosted |
| Mode 5 Autonomous production agents | As Mode 4, plus calls, retries and tool use per completed task, measured outside the agent | As Mode 4 |
Staff are not the object of this measurement. A meter that logs each employee's queries and an energy figure computed per person fall under employee representatives' rights: at Nordvik Region the negotiation under MBL applies before a per-person AI-use meter is switched on (MBL-NR-IT-2027-01), and at Hansa Mutual section 87(1) no. 6 of the Works Constitution Act applies. The plan counts at the level of use, route and pool, never at the level of a named person.
Across the degrees of delegation
An agent that collects, joins or reports measurements is itself an AI use with a footprint and a mandate. At Level 0 Advisory or Level 1 Assisted it proposes, and a named person approves. At Level 2 Supervised it may run collection and draft footprint records for review; at Level 3 Bounded it may run a codified collection playbook on a schedule, with the check outside it. Level 4 Autonomous is never used for the publication of an environmental claim or for an action that disables the meter, the budget or the stop path. An agent that reports does not also verify the report.
Nordvik Region and Hansa Mutual
Table 8.5 shows where the two organisations stand at the start of the measurement work.
Table 8.5: The two organisations at the start of the measurement work (illustrative).
| Nordvik Region (illustrative) | Hansa Mutual (illustrative) | |
|---|---|---|
| Starting point | One aged figure (1.90 g, October 2026); gateway telemetry of tokens and cost | Rack-level meters in Frankfurt; a monthly group report with partial boundary |
| Main route to figures | Supplier disclosure through a framework and contract, with SDR-NR-0001 and SDR-NR-0002 |
Own meters and attribution, with cloud tools as cross-check |
| Main weakness | No metered kWh for the reserved pool; hosted route on rung 5; embodied unsourced | Cloud A burst unmetered; agent energy per task not yet measured end to end |
| Records this chapter | MPL-NR-0001, FPR-NR-0001, SDR-NR-0001, SDR-NR-0002 |
FPR-HM-0002 (Frankfurt part and the exclusion) |
| Next | Requirement in TA-NR-ENV-01 for metered kWh and per-use disclosure |
A method note for counting AI inside Scope 3, signed by the head of group sustainability |
Nordvik Region, which cannot meter the machines, builds on what it can contract for; Hansa Mutual builds on its meters and checks supplier figures. Neither escapes the age limit, the independent check or the boundary.
The footprint of this book
This section applies the Count test of E1 Measure to the production of this book, measured on 16 November 2026. The example is real, not illustrative. It shows what a record looks like when the counting is done after the work, and where it fails the other tests of the net-benefit principle.
Unit, boundary and what is not counted
The functional unit is one edition of the manuscript as merged on 16 November 2026: 33 files and 231,220 words, counted as prose, tables and headings, with code blocks and the Sources sections left out. An independent count that split the same text on whole tokens gave 225,552 words, 2.5 per cent fewer; this chapter keeps the first count, and the per-1,000-word figures would be 2.5 per cent higher on the second. The boundary is the operational inference energy of the 101 recorded transcripts of the delegated agents that drafted, checked and revised it, from the first recorded event at 21:00 UTC on 15 November 2026 to the measurement at 08:18 UTC on 16 November 2026. Work after that moment is outside the boundary: the sections on life cycle assessment (Chapter 5) and environmental management systems (Chapter 24), their fact-check and their integration were written later, so the figures describe an edition slightly smaller than the one published, and the record is re-measured before release. Their usage fields give 8,063,025 output tokens, 13,786 input tokens outside the cache, 40,048,021 tokens written to a cache and 1,835,637,219 tokens read from one. A cache stores the model's processed form of text it has already been sent, so that a later call need not process it again (Chapter 13). Cache reads are 97 per cent of all tokens, about 271,000 per assistant message, because each message re-reads the working context.
A record states what it leaves out. This one leaves out the orchestrating session, whose usage is not in the transcripts; any agent whose transcript was not recorded; the training of the models; hardware manufacture and facility construction; network transfer; local sandbox compute, about eleven hours of wall clock and not metered; continuous-integration builds; hosting and reading of the website; text-to-speech and rendering for the book's short; and the time and devices of the author and the reviewers. Every exclusion would add to the total, so the figures below describe a counted part, and nothing says it is the largest.
Method and its limits
No provider has published energy per token for the models used, and neither the hardware nor the grid is known. The calculation, a short script kept with the book's working files, therefore uses proxies. Oviedo and colleagues model a median query at 0.31 Wh and a median reasoning response of 5,000 output tokens at 3.91 Wh (interquartile range 2.15 to 7.05 Wh), at the boundary of node power times PUE (52, Oviedo et al., 2026) (Chapter 6). Those are a published median query and a reasoning response, vendor-authored and modelled, not the provider's figures for the models used. All three scenarios use the median reasoning response as the rate: 3.91 Wh per 5,000 tokens, 0.78 mWh per output token. The floor counts output tokens only at that rate. The central scenario adds new input and cache writes at 1 per cent of that rate and cache reads at 0.1 per cent. The ceiling multiplies the central rate by 1.31, the idle and redundancy factor that the paper keeps outside its headline figures, and charges every token at it. The shares of 1 and 0.1 per cent are assumptions of the calculation without a source. The grid is assumed too, because the location is unknown: 20 g CO2e per kWh for a Nordic-like grid and 350 for a continental one, location-based, 2026.
The rate is itself uncertain. The paper's own examples span about 0.78 mWh per output token (the median 5,000-token response) to about 1.05 mWh (the lower-quartile response of roughly 2,040 tokens, 2.15 Wh) and about 1.03 mWh (the 0.31 Wh median query of 300 tokens, Chapter 6). Energy per token in the paper is therefore not a simple function of length, and no per-token low figure can be read from it. The proxy carries roughly 35 per cent either way on top of the share assumptions, and the floor is output tokens only at the central proxy: it is not a lower bound on the true energy, which the models used may fall below or exceed.
Table 8.6: Operational inference energy of the recorded agent transcripts that produced this book, measured 16 November 2026 (tokens measured, energy estimated, location-based, grid assumed).
| Scenario | Energy (kWh) | kg CO2e at 20 g/kWh | kg CO2e at 350 g/kWh | Wh per 1,000 words | Person-hours of a 50 W device with equal energy |
|---|---|---|---|---|---|
| Floor (output tokens only, central proxy) | 6.3 | 0.13 | 2.21 | 27.3 | 126 |
| Central | 8.1 | 0.16 | 2.82 | 34.8 | 161 |
| Ceiling | 1,929.8 | 38.60 | 675.42 | 8,346.0 | 38,595 |
The ceiling is about 240 times the central value, and 1,880 of its 1,930 kWh come from charging cache reads at the full output rate. The data say how many tokens were read from the cache. What one cached token costs in energy is the unknown, and most of the spread between floor and ceiling is that unknown, with the uncertainty of the rate on top, not statistical error. A cache read is expected to cost far less than generating a token, but that is unmeasured here and not published for these models. The ceiling is not a credible estimate; it is what the widest assumption allows, as the method asks, and the central value is a position between two assumptions, not a measurement. The last column is a scale marker only. A comparison with a human route would need a baseline that delivers the same book at the same checked quality, and nobody measured one.
The result against the three tests
Count is partly passed. The unit, boundary, year, method and kind of every figure are stated, and the exclusions are listed. The orchestrating session is missing, the range spans a factor of about 300, and the independent check is none: the producer counted its own transcripts, and no second source or provider figure exists. Cap is failed. No environmental budget was set before the work and no stop path was defined for one; the measurement was made afterwards, from transcripts, so it could not have stopped anything. Compare was not made. There is no benefit record, and the book does not offset: it does not claim that its argument is worth its footprint, nor set any benefit against the figure.
Five things would have changed the position: tags on each agent run by chapter and task, so that tokens per chapter were known while the work ran; a budget per chapter, set by someone other than the agents, with cache reads reported separately and enforced outside them (Chapter 15); routing low-risk drafting and mechanical checks to a smaller model, the second level of the optimisation hierarchy, with the saving measured and not assumed (Chapter 12); shorter contexts and fresh agents for separate tasks, to reduce re-reading (Chapter 13); and a named person able to halt the run from outside the agents, with the halt drilled once.
# footprint/FPR-BK-0001.yaml (the book's own production; measured token counts, estimated energy; not illustrative)
# cap: no budget was set before the work and no stop path was defined (Chapter 4); the Cap test is failed
id: FPR-BK-0001
revision: 1
use: production of this book, 33 files drafted, checked and revised by delegated agents
owner: unassigned                   # no owner named yet; the author names one before release
functional_unit: one edition of the manuscript (231,220 words)
period: 2026-11
volume: 1
boundary:
  scope: operational
  included: [inference energy of the 101 recorded agent transcripts, through proxy energy per token]
  excluded: [orchestrating session, unrecorded agents, model training, hardware manufacture, network, sandbox compute (about 11 h), CI runners, hosting and reading, text-to-speech and rendering for the short, author and reviewer time and devices]
  carbon_basis: location-based
  grid_g_per_kwh: {value: 20, year: 2026, source: assumption, continental_alternative: 350}
method:
  type: estimate from recorded token counts
  carbon_check_tolerance: 0.005      # carbon is energy times grid to within 0.5 per cent for this record
  tokens: {output: 8063025, cache_creation: 40048021, cache_read: 1835637219, input: 13786}
  proxy: {reasoning_response_wh: 3.91, reasoning_tokens: 5000, spread_in_paper_mwh_per_output_token: [0.78, 1.05], ceiling_factor: 1.31, source: "Oviedo et al. 2026, node times PUE, not these models"}
  share_of_output_rate: {floor: [0, 0], central: [0.01, 0.001], ceiling: [1, 1]}   # [new input tokens, cached tokens]
result:
  energy_wh_per_unit: {low: 6305, central: 8054, high: 1929764}
  carbon_g_per_unit: {low: 126, central: 161, high: 38595}          # at 20 g/kWh; at 350 g/kWh: 2207, 2819, 675417
dominating_assumptions: [energy charged per cached token, energy per output token, grid factor, orchestrating session not counted]
independent_check:
  status: none
  open: counted by the producer from its own transcripts; no second source and no provider figure for these models
evidence:
  - {item: token counts, measured_on: 2026-11-16, source: usage fields of recorded transcripts, valid_days: 90}
  - {item: energy per token, kind: assumption, source: proxy from a published model}
  - {item: cached-token share, kind: assumption, source: author of the calculation}
labels: [measured-tokens, estimated-energy]
The record is FPR-BK-0001, the prefix BK standing for the book; its measured evidence expires 90 days after 16 November 2026, and the figures are re-measured before release. The lesson is the book's own conclusion: a footprint counted afterwards describes the work and governs nothing, and the three tests cost least when the tags, the budget and the stop path exist before the first agent starts.
Observable, expected, speculation
Observable. SCI is published as ISO/IEC 21031:2024. The Green Software Foundation announced its SCI for AI specification as ratified on 17 December 2025. The customer carbon tools of Amazon Web Services and Google Cloud, in the documents read, allocate by usage metrics or revenue and not by accelerator activity, and Google states that its customer data is not third-party assured. The draft standard prEN 18287:2026 is in public enquiry, and the GHG Protocol's Scope 3 revision is a draft.
Expected. The enquiry on prEN 18287:2026 closes on 23 December 2026 and its catalogue entry gives 17 March 2027 as a due date, so a published European standard is expected to follow; whether it will be referenced under the AI Act is not established. A revised GHG Protocol Scope 3 standard is expected, with public consultation first.
Speculation. A single, widely accepted per-task metric that providers disclose on one boundary is plausible and unevidenced; the figures in this chapter's table sit on different boundaries today, and nothing read for it says when that will change.
Summary
Measuring in practice is a system of sources, collection, validation, storage and review, with the review and a second source kept outside the collector. This chapter concerns E1 Measure. An organisation can usually meter the facility if it owns one, the rack and accelerator if it owns the hardware, and the gateway, tags and invoices in every case. It must ask suppliers for what only they can meter, and the customer carbon tools read here do not attribute energy to one AI use. Standards differ in status: SCI is an ISO/IEC standard, SCI for AI a ratified specification, ISO/IEC TR 20226 a technical report, AFNOR SPEC 2314 a published framework and prEN 18287:2026 a draft.
Every figure carries a boundary, a year, a kind and an age limit: in this book's convention 90 days for a measured footprint of a running use and 12 months for a supplier disclosure, less if the model, region or volume changes. Nordvik Region's 1.90 g per resolved enquiry has expired by that rule; its replacement, a draft estimate of 0.98 g (range 0.85 to 1.17) for the operational phase of one route, is honest because it names its assumptions and its open check. When a supplier cannot give a figure, the buyer states the rung of the ladder it stands on and writes the missing item into a clause with a date. The book applied the Count test to its own production and failed the Cap test (FPR-BK-0001).
In the terms of the net-benefit principle, this chapter equips the Count test: it makes the footprint countable at a stated boundary with evidence that can be inspected. It does not decide whether a use is worth its footprint. Chapter 9 takes up the Compare test, with the benefit record, the baseline and the non-AI alternative.
Sources
- European Parliament and Council of the European Union. Regulation (EU) 2024/1689 laying down harmonised rules on artificial intelligence (Artificial Intelligence Act). Official Journal of the European Union, 12 July 2024. (1, European Union, 2024)
- European Parliament and Council of the European Union. Directive (EU) 2023/1791 on energy efficiency (recast). Official Journal of the European Union, 20 September 2023. (5, European Union, 2023)
- European Commission. Commission Delegated Regulation (EU) 2024/1364 on the first phase of the establishment of a common Union rating scheme for data centres. Official Journal of the European Union, 17 May 2024. (6, European Commission, 2024)
- European Commission. The General-Purpose AI Code of Practice. European AI Office, 10 July 2025. (9, European Commission, 2025)
- Green Software Foundation (2024). Software Carbon Intensity (SCI) specification, adopted as ISO/IEC 21031:2024. (21, Green Software Foundation, 2024)
- Nordqvist, G. (2026). AI Platform and Security. The Transformed Architecture, Book 3. (27, Nordqvist, 2026)
- Nordqvist, G. (2026). AI Purple. The Transformed Architecture, Book 9. (33, Nordqvist, 2026)
- Nordqvist, G. (2026). AI Operations. The Transformed Architecture, Book 10. (34, Nordqvist, 2026)
- Green Software Foundation (2026). Software Carbon Intensity for AI Specification. Repository Green-Software-Foundation/sci-ai, SPEC.md, https://github.com/Green-Software-Foundation/sci-ai (retrieved November 2026). (75, Green Software Foundation, 2026)
- Green Software Foundation (2025). SCI for AI specification ratified. Announcement, 17 December 2025, https://greensoftware.foundation/articles/sci-ai-specification-ratified-standard-for-measuring-ai-emissions-across-the/ (retrieved November 2026). (76, Green Software Foundation, 2025)
- Amazon Web Services (2025). AWS Customer Carbon Footprint Tool methodology, Model Version 3.0, October 2025, https://sustainability.aboutamazon.com/aws-customer-carbon-footprint-methodology.pdf (retrieved November 2026). (83, AWS, 2025)
- Google Cloud (n.d.). Carbon Footprint reporting methodology, https://docs.cloud.google.com/carbon-footprint/docs/methodology (retrieved November 2026). (84, Google Cloud, n.d.)
- Kepler maintainers (n.d.). Kepler Power Attribution Guide, Cloud Native Computing Foundation project, https://github.com/sustainable-computing-io/kepler/blob/main/docs/developer/power-attribution-guide.md (retrieved November 2026). (86, Kepler maintainers, n.d.)
- NVIDIA (2026). NVML API header nvml.h (NVML API version 13), https://github.com/NVIDIA/go-nvml (retrieved November 2026). (87, NVIDIA, 2026)
- Cast AI (2026). 2026 State of Kubernetes Optimization Report, press release, 21 April 2026, https://cast.ai/press-release/2026-state-of-kubernetes-optimization-report/ (retrieved November 2026; vendor-reported). (85, Cast AI, 2026)
- European Commission (n.d.). Model Documentation Form, Transparency chapter of the General-Purpose AI Code of Practice, https://ec.europa.eu/newsroom/dae/redirection/document/118118 (retrieved November 2026). (74, European Commission, 2025)
- FinOps Foundation (n.d.). Sustainability, FinOps Framework capability, https://www.finops.org/framework/capabilities/sustainability/ (retrieved November 2026; undated page). (88, FinOps Foundation, n.d.)
- Upphandlingsmyndigheten (2025). Förslag till hållbarhetskriterier för datacentertjänster, consultation draft of 29 September 2025 (retrieved November 2026; draft; the agency's later criteria pages are undated and are read in Chapter 23). (89, Upphandlingsmyndigheten, 2025)
- CEN/CENELEC (2026). oSIST prEN 18287:2026, Artificial Intelligence: Requirements and guidance for the environmental impact evaluation of artificial intelligence systems and services, catalogue entry, https://standards.iteh.ai/catalog/standards/sist/265b3d78-ea51-4114-a1c8-342edc39e39f/osist-pren-18287-2026 (retrieved November 2026; draft in public enquiry). (77, CEN/CENELEC, 2026)
- ITU (2026). Recommendation ITU-T L.1801 (02/2026), Guidelines for assessing the environmental impact of artificial intelligence systems, https://www.itu.int/rec/T-REC-L.1801/en (retrieved November 2026; summary page read). (78, ITU, 2026)
- AFNOR (2024). AFNOR Spec 2314: General framework for frugal AI, https://www.afnor.org/en/news/artificial-intelligence/reference-framework-reduce-environmental-impact-ai/ (retrieved November 2026). (79, AFNOR, 2024)
- GHG Protocol (2026). Scope 3 Standard Revisions: Phase 1 Progress Update, March 2026, https://ghgprotocol.org/sites/default/files/2026-03/S3-Phase1ProgressUpdate-20260331.pdf (retrieved November 2026; draft). (80, GHG Protocol, 2026)
- ISO/IEC (2025). ISO/IEC TR 20226:2025, Information technology, Artificial intelligence: Environmental sustainability aspects of AI systems, https://www.iso.org/standard/86177.html (retrieved November 2026; catalogue entry, full text not read). (81, ISO/IEC, 2025)
- ISO/IEC (2022). ISO/IEC 30134-9:2022, Information technology, Data centres, Key performance indicators, Part 9: Water usage effectiveness (WUE), catalogue entries (retrieved November 2026; full text not read). (82, ISO/IEC, 2022)
- Elsworth, C. et al. (2025). Measuring the environmental impact of delivering AI at Google Scale. arXiv:2508.15734, 21 August 2025, https://arxiv.org/abs/2508.15734 (retrieved November 2026; vendor-authored). (51, Elsworth et al., 2025)
- Panigrahy, D. et al. (2026). Energy per Successful Goal: Goal-Level Energy Accounting for Agentic AI Systems. arXiv:2605.22883, version 2, 12 October 2026, https://arxiv.org/abs/2605.22883 (retrieved November 2026; preprint). (111, Panigrahy et al., 2026)
- Oviedo, F. et al. (2026). Energy use of AI inference, efficiency pathways, and test-time scaling. Joule 10(8), 102430, August 2026; text read from the preprint arXiv 2509.20241, retrieved November 2026. (52, Oviedo et al., 2026)